

Pathway and protein interaction context of a gene: PIK3CA
How to get the pathway and protein interaction context of a gene in one BioQ query, shown for PIK3CA with Reactome, STRING v12 and DepMap data.
Data as of November 6, 2026 · By the BioQ team
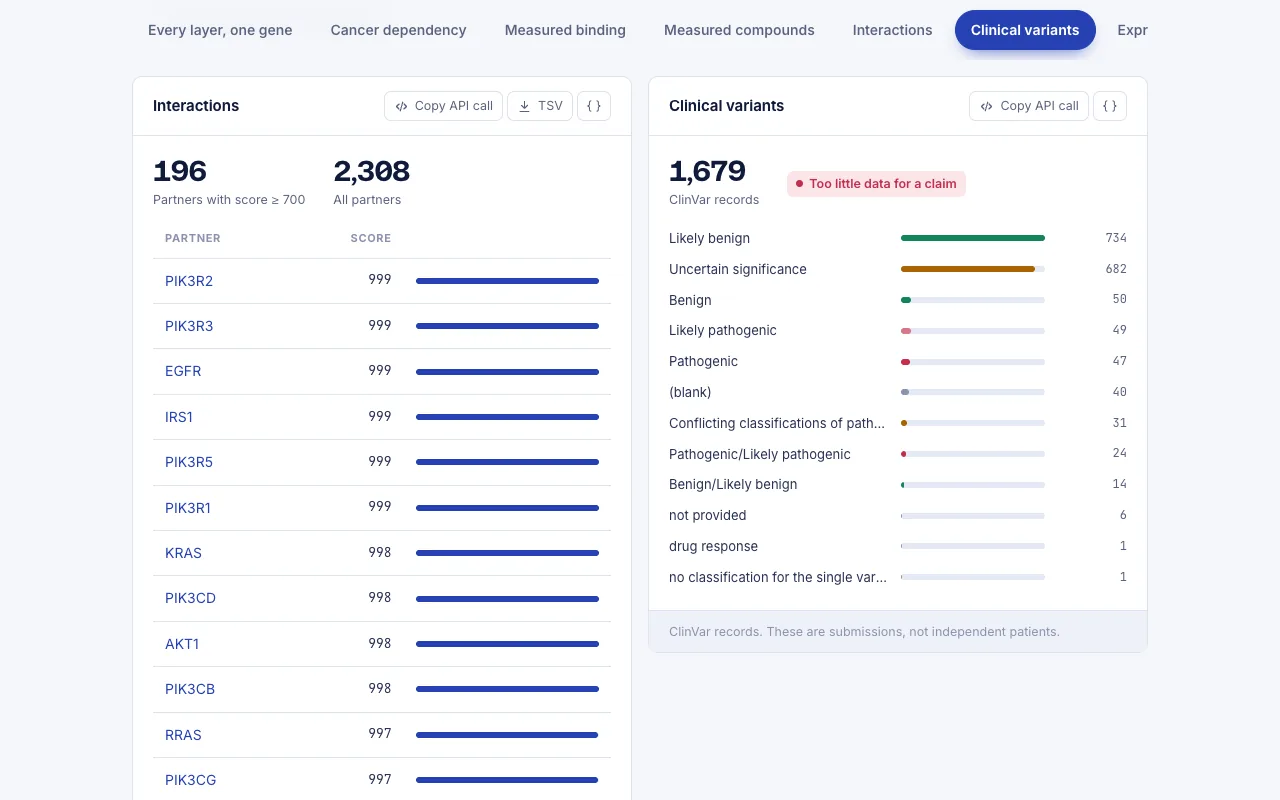
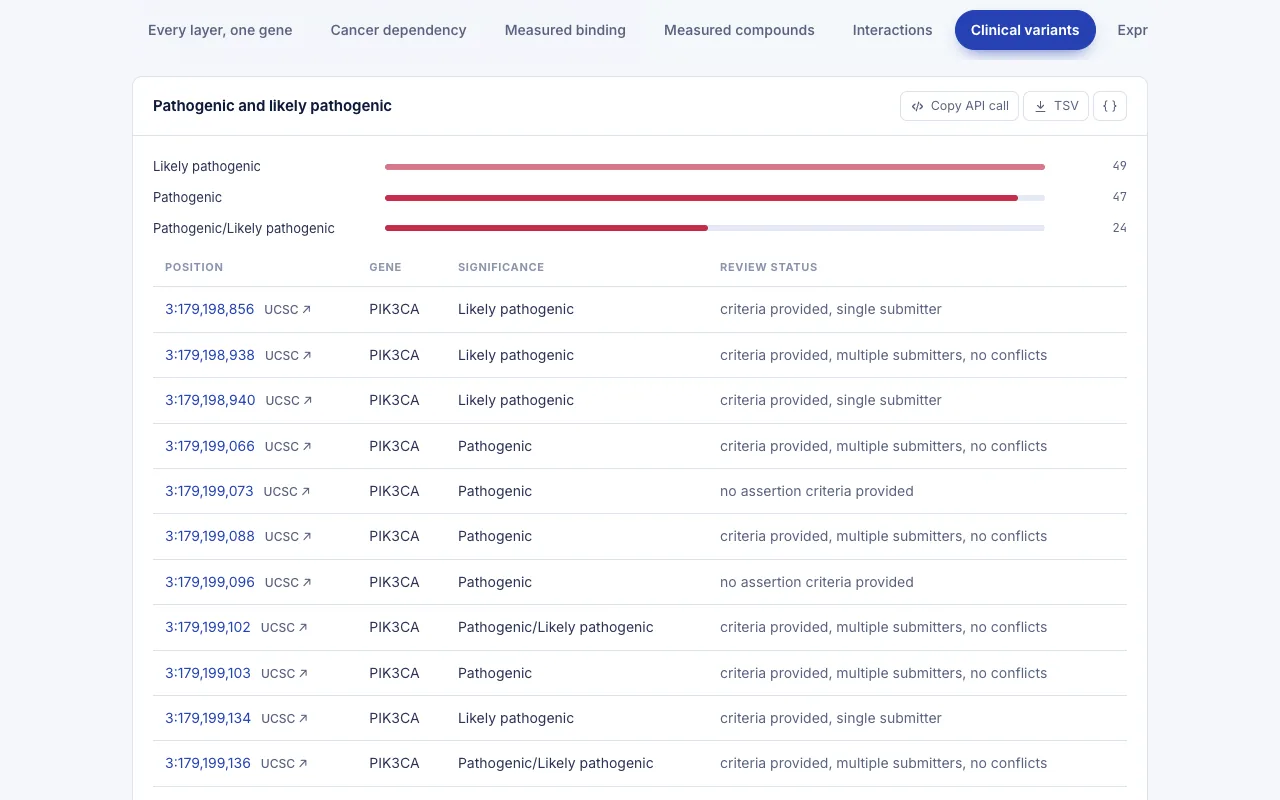
For PIK3CA, the pathway and protein interaction context of a gene comes back from one BioQ query: 137 Reactome pathways, 2308 STRING interaction partners, and a DepMap dependency summary in which 460 of 1178 cell lines are dependent. The engine took 0.29 seconds across 3 queries. All data are as of 2026-11-06.
What we asked: the pathway and protein interaction context of a gene
A typical early step with a new gene is to place it in a network. Which pathways is it annotated in? Which proteins does it connect to? Does removing it hurt cells? For PIK3CA, the catalytic subunit of a class I PI3K, these questions come up in work on PI3K signalling and in any project that touches alpelisib.
The manual route means opening Reactome for the pathways, STRING for the partners, and DepMap for the knockout data. You then reconcile identifiers and releases by hand and keep notes on where each number came from.
In BioQ the input is the gene symbol alone:
PIK3CA
BioQ sent this to three public resources (Reactome, STRING v12 and DepMap) in 3 engine queries. Every block below names its source.
What BioQ returned
Reactome pathways
Reactome lists 137 pathways for PIK3CA. The table shows 6, ordered most specific first, meaning the smallest pathways come first.
| Pathway | Reactome ID | Genes in pathway |
|---|---|---|
| Activated NTRK3 signals through PI3K | R-HSA-9603381 | 6 |
| MET activates PI3K/AKT signaling | R-HSA-8851907 | 6 |
| Activated NTRK2 signals through PI3K | R-HSA-9028335 | 7 |
| Signaling by LTK in cancer | R-HSA-9842640 | 7 |
| PI3K/AKT activation | R-HSA-198203 | 9 |
| PI3K events in ERBB4 signaling | R-HSA-1250342 | 10 |
STRING interaction partners
STRING v12 reports 2308 partners. The table shows the top 8 by combined score. A higher score means more supporting evidence for the pair.
| Partner | UniProt | STRING combined score |
|---|---|---|
| PIK3R2 | O00459 | 999 |
| PIK3R3 | Q92569 | 999 |
| EGFR | P00533 | 999 |
| IRS1 | P35568 | 999 |
| PIK3R5 | Q8WYR1 | 999 |
| PIK3R1 | P27986 | 999 |
| KRAS | P01116 | 998 |
| PIK3CD | O00329 | 998 |
DepMap CRISPR dependency
DepMap (release depmap_24q4) covers 1178 cell lines for PIK3CA. Of these, 460 are dependent, which is 39.0 percent. The mean Chronos gene effect is -0.486, and PIK3CA is not flagged as common essential. A more negative Chronos gene effect means the knockout reduced viability more. The table shows the 6 lineages with the most negative mean effect.
| Lineage | Cell lines | Dependent | % dependent | Mean gene effect |
|---|---|---|---|---|
| Esophagus/Stomach | 69 | 41 | 59.4 | -0.7 |
| Breast | 53 | 29 | 54.7 | -0.674 |
| Bladder/Urinary Tract | 34 | 19 | 55.9 | -0.668 |
| Peripheral Nervous System | 44 | 26 | 59.1 | -0.6 |
| Head and Neck | 77 | 47 | 61 | -0.586 |
| Bowel | 63 | 36 | 57.1 | -0.579 |
What it means and how to read it
Pathways. The 6 pathways shown are the most specific of 137, not the most important. They are small, with 6 to 10 genes each, and most describe receptor tyrosine kinase signals handing over to PI3K: NTRK3, NTRK2, MET, LTK and ERBB4. "PI3K/AKT activation" (R-HSA-198203, 9 genes) is the generic entry. If you want the broad picture, ask for more rows or look at the larger parent pathways. The short list is a map of where PIK3CA is wired in, not a ranking.
Partners. The top of the STRING list reads as expected for this gene. It contains PIK3R1, PIK3R2, PIK3R3 and PIK3R5, plus PIK3CD, together with EGFR, IRS1 and KRAS. Scores of 999 and 998 are at the very top of the scale. The combined score integrates several kinds of evidence, so a high score supports a functional association. It does not by itself show a direct physical contact. With 2308 partners in total, the long tail is far weaker than the first 8 rows.
Dependency. A mean effect of -0.486 with 39.0 percent of lines dependent describes a gene whose loss matters in a subset of cells, not in all of them. The lineage table shows where it concentrates. Esophagus/Stomach has 41 dependent lines of 69, Breast has 29 of 53, and Head and Neck has 47 of 77. A dependency here is defined by a named Chronos threshold, so the percentages move if that threshold is changed.
What to do next.
- Pick one of the receptor-linked pathways and open its member list to see which upstream genes are annotated alongside PIK3CA.
- Take the top partners and run each through the same query. PIK3R1 and KRAS are natural first checks.
- Filter the dependency view to one lineage and compare it with the mutation status of the lines in your own model.
- For the drug angle, run a separate query on alpelisib to see what BioQ returns on its targets and trials.
The comparison with the manual route is about work, not a time claim. The three tables above draw on 3 distinct resources, with identifiers already matched and releases stated beside each block. The only speed figure we report is the measured engine time of 0.29 seconds.
How to reproduce it in BioQ
- Open BioQ and type the gene symbol exactly as below into the search box.
PIK3CA- Read the three blocks in order: Reactome pathways, STRING interaction partners, DepMap dependency by lineage.
- Check the release label on each block (Reactome, STRING v12, depmap_24q4). Note them in your methods if you use the numbers, because counts change between releases.
- Ask a follow-up in plain language, such as more pathways, a single partner, or one lineage, to go deeper on the block that matters for your question.
Limits: what the data do not show
- The pathway list is annotation, not measurement. A gene's presence in a Reactome pathway says curators placed it there, not that the pathway is active in your cells.
- The 6 pathways and 8 partners are small slices of 137 and 2308. Conclusions about the whole network need the full lists.
- STRING scores mix evidence types and do not distinguish direct binding from indirect association. They also say nothing about direction or effect.
- DepMap reflects cell lines grown in culture. It cannot tell you about tumours in patients, and it does not say whether a mutation in PIK3CA is the reason a line depends on it.
- Nothing here addresses drug response, dosing or treatment. Alpelisib is only a pointer for a follow-up query, and this result contains no data on it.
- The numbers are a snapshot as of 2026-11-06 and will change as the underlying releases are updated.
Data and method
The numbers on this page were read from the BioQ engine on 2026-11-06 (3 queries, 0.3 s of engine time in total). The tables are generated by code from the engine's answers; the text only restates them.
/depmap, /interaction, /pathway
Run the same query yourself: PIK3CA
For research use only. This page summarises public data and is not medical advice.
BioQ is an AI search engine and agent with one goal: making biology research 100X faster. Ask in the web app, over the REST API, or from Claude, ChatGPT or Cursor through MCP.
Queries used
Frequently asked questions
How many Reactome pathways include PIK3CA?
Reactome lists 137 pathways for PIK3CA. BioQ showed 6 of them, ordered most specific first, such as "PI3K/AKT activation" (R-HSA-198203) with 9 genes.
What are the top STRING interaction partners of PIK3CA?
STRING v12 reports 2308 partners. The top rows include PIK3R2, PIK3R3, EGFR, IRS1, PIK3R5 and PIK3R1 at a combined score of 999, then KRAS and PIK3CD at 998.
Is PIK3CA a common essential gene in DepMap?
No. In depmap_24q4, PIK3CA is not flagged as common essential. 460 of 1178 cell lines are dependent (39.0 percent), and the mean Chronos gene effect is -0.486.
Which lineages depend most on PIK3CA in DepMap?
By mean gene effect, Esophagus/Stomach leads at -0.7 with 41 dependent lines of 69. Breast follows at -0.674 with 29 of 53, and Bladder/Urinary Tract at -0.668 with 19 of 34.
How long does the PIK3CA context query take?
The engine took 0.29 seconds in total for 3 queries, drawing on 3 distinct resources.
Sources
Results come from public databases as of the date shown and may change. BioQ gives research information, not medical advice.
More from the blog
MDM2 vs MDM4: dependency and drugs side by side
MDM2 vs MDM4 in DepMap 24q4 Chronos data and drug annotations: 384 of 1178 cell lines depend on MDM2, 142 on MDM4; 12 drugs listed for MDM2, 1 for MDM4.
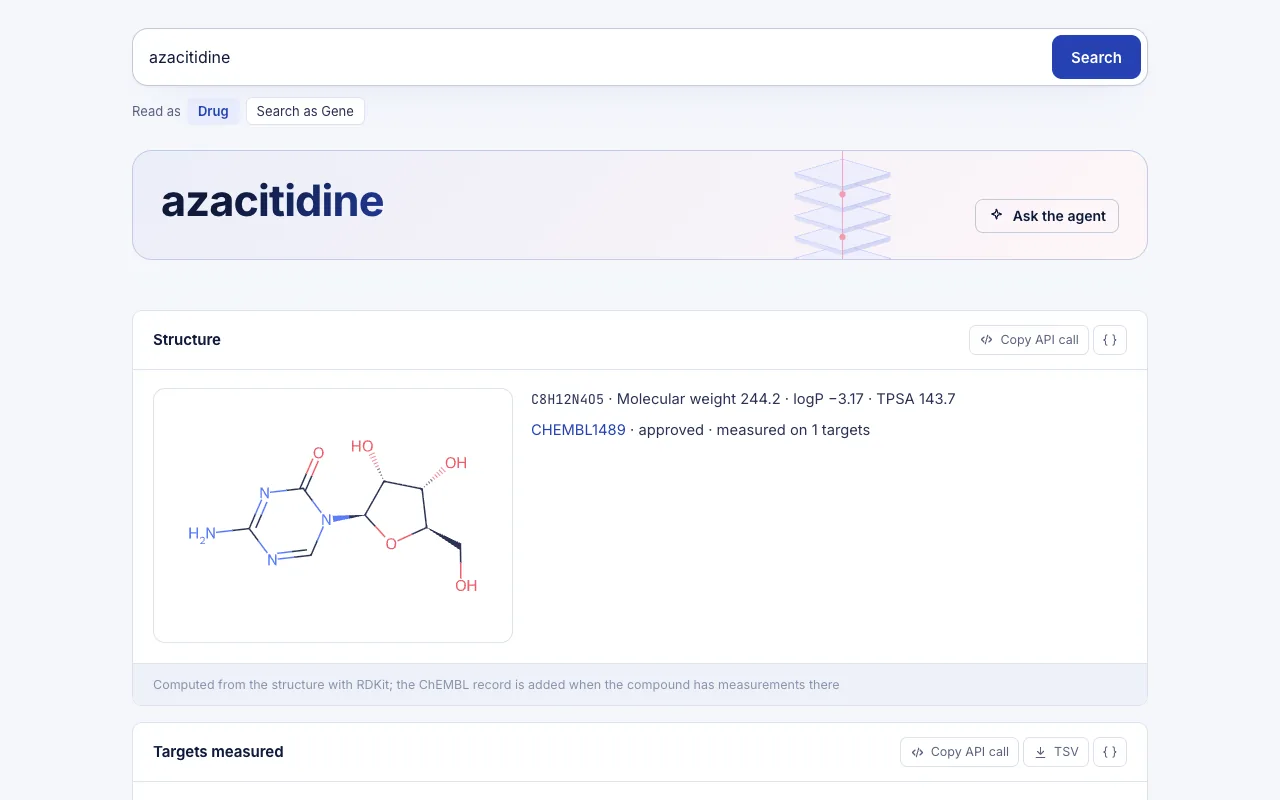
Azacitidine Ropeginterferon trial NCT07646821
Phase 1b/2 trial NCT07646821 adds ropeginterferon alfa-2b to azacitidine in TP53-mutated MDS/AML; ChEMBL, ClinicalTrials.gov and DepMap data as of 2026-11-15.
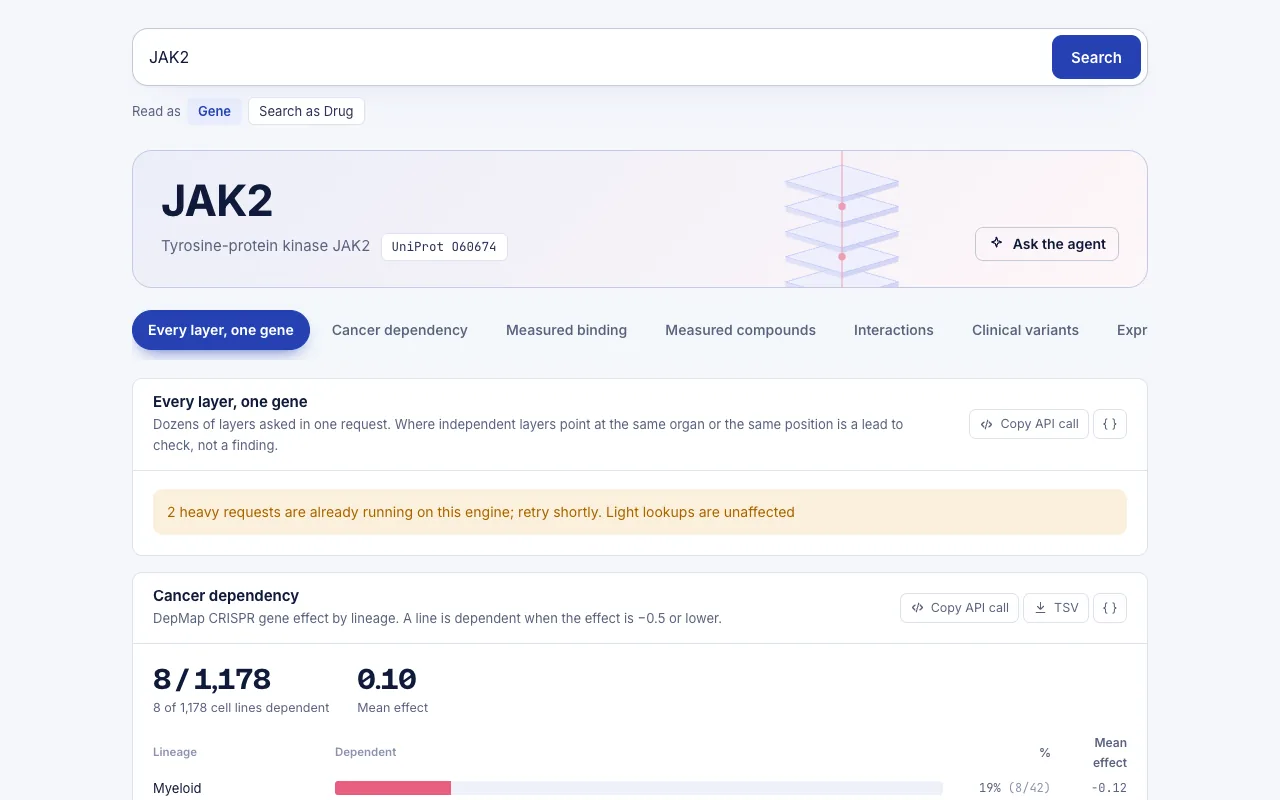
JAK2 vs TYK2: dependency and drugs side by side
JAK2 vs TYK2 in DepMap and drug databases: 8 of 1178 cell lines are dependent on JAK2, 11 on TYK2; 47 drugs are known for JAK2 and 20 for TYK2.