

JAK2 vs TYK2: dependency and drugs side by side
JAK2 vs TYK2 in DepMap and drug databases: 8 of 1178 cell lines are dependent on JAK2, 11 on TYK2; 47 drugs are known for JAK2 and 20 for TYK2.
Data as of November 14, 2026 · By the BioQ team
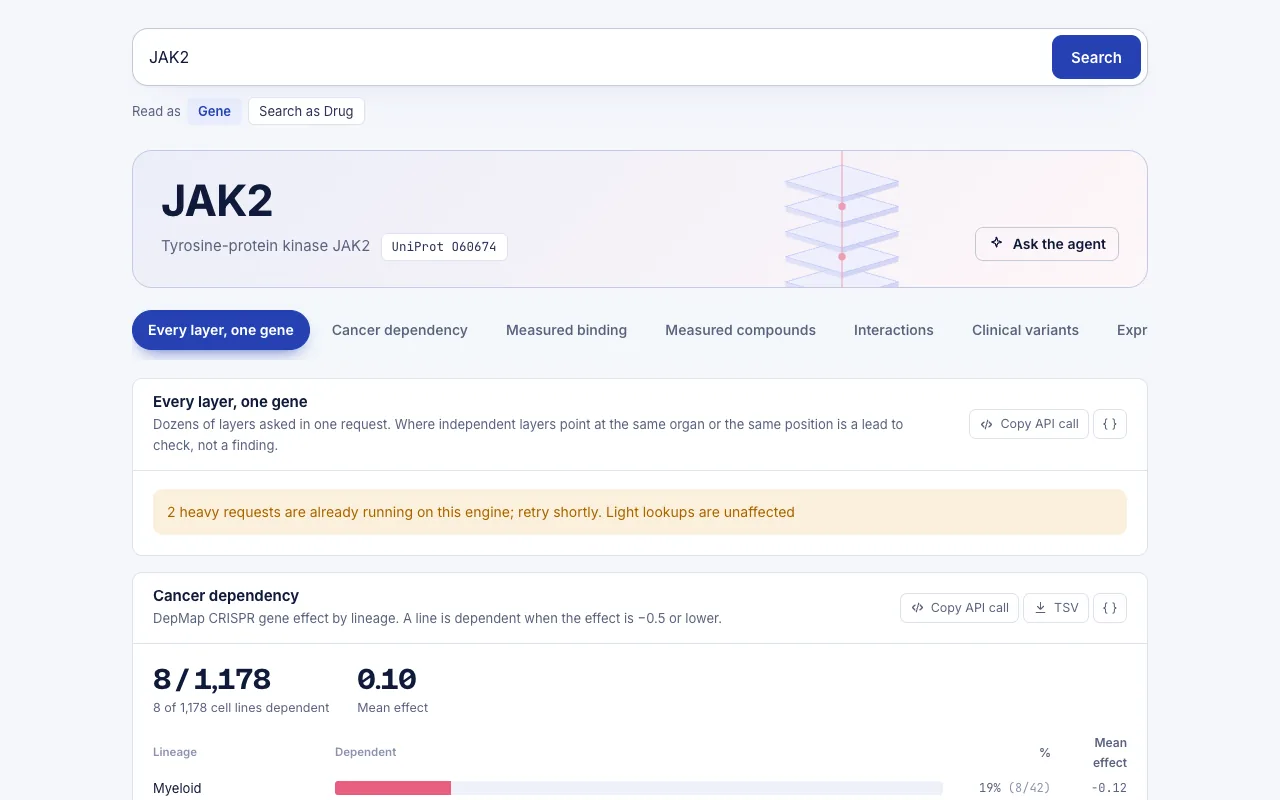
In DepMap, 8 of 1178 cell lines are dependent on JAK2 (0.7%), and all 8 are myeloid. TYK2 has 11 dependent lines (0.9%) spread over several lineages. On the drug side, 47 drugs are listed for JAK2 and 20 for TYK2. All figures are as of 2026-11-14.
What we asked
JAK2 and TYK2 are paralogs in the JAK family, and many JAK inhibitors are described by how they act on one or the other. We put the same two questions to each gene:
- In which lineages does CRISPR knockout reduce cell viability (the CRISPR dependency question)?
- Which drugs are known for the gene, how far have they progressed, and what potency has been reported?
Running identical blocks for both genes means any difference comes from the genes, not from how we asked. The dependency blocks use the DepMap release depmap_24q4 with the Chronos gene effect. A more negative value means the knockout reduced viability more. A line counts as dependent when its effect falls at or below a threshold. That threshold is a named constant in the release, not a property of the data.
What BioQ returned
Dependency by lineage
Both genes were tested in the same 1178 cell lines, and neither is flagged as common essential. The mean gene effect across all lines is 0.095 for JAK2 and -0.022 for TYK2. On average, then, neither knockout lowers viability much.
JAK2, top lineages by mean gene effect:
| Lineage | Cell lines | Dependent | % dependent | Mean gene effect |
|---|---|---|---|---|
| Myeloid | 42 | 8 | 19.1 | -0.12 |
| Eye | 15 | 0 | 0 | 0.041 |
| Thyroid | 11 | 0 | 0 | 0.049 |
| Head and Neck | 77 | 0 | 0 | 0.074 |
| Pleura | 21 | 0 | 0 | 0.075 |
TYK2, top lineages by mean gene effect:
| Lineage | Cell lines | Dependent | % dependent | Mean gene effect |
|---|---|---|---|---|
| Pleura | 21 | 1 | 4.8 | -0.08 |
| Esophagus/Stomach | 69 | 3 | 4.3 | -0.053 |
| Lymphoid | 93 | 0 | 0 | -0.045 |
| Head and Neck | 77 | 2 | 2.6 | -0.044 |
| Myeloid | 42 | 1 | 2.4 | -0.043 |
Drugs known for TYK2
For TYK2, 20 drugs are listed and 6 are shown. For JAK2, 47 are listed. The JAK2 list shows ruxolitinib (exact pChEMBL 10.44, KD), baricitinib (9.54, IC50), tofacitinib (9.3, IC50), tofacitinib citrate (9.22, KD), fedratinib (9.12, IC50) and pacritinib (9.0, IC50). All six have a maximum clinical stage of APPROVAL.
| Drug | Max clinical stage | Mechanism | Best exact pChEMBL | Type | Trials by name |
|---|---|---|---|---|---|
| Deucravacitinib | APPROVAL | Tyrosine-protein kinase TYK2 negative allosteric modulator | 11.1 | KD | 52 |
| Ruxolitinib | APPROVAL | Tyrosine-protein kinase TYK2 inhibitor | 9.4 | IC50 | 281 |
| Tofacitinib | APPROVAL | Janus Kinase (JAK) inhibitor | 9.4 | IC50 | 102 |
| Filgotinib | APPROVAL | Tyrosine-protein kinase TYK2 inhibitor | 8.95 | IC50 | 41 |
| Upadacitinib | APPROVAL | Tyrosine-protein kinase TYK2 inhibitor | 8.4 | IC50 | 93 |
| Tofacitinib Citrate | APPROVAL | Janus Kinase (JAK) inhibitor | 8.36 | KI | 3 |
The query ran 4 engine queries over 2 distinct resources in 0.64 engine seconds in total.
What it means: reading JAK2 vs TYK2 side by side
Where they differ in dependency. JAK2 dependency is concentrated. The Myeloid lineage has 8 dependent lines out of 42 (19.1%) and a mean gene effect of -0.12. The other four lineages in the table have 0 dependent lines. TYK2 shows the opposite pattern: weak signal in many lineages. Pleura has 1 dependent line of 21 (4.8%), Esophagus/Stomach has 3 of 69 (4.3%), Head and Neck has 2 of 77 (2.6%), and Myeloid has only 1 of 42 (2.4%). In the shared Myeloid lineage, JAK2 is clearly the stronger dependency. In Pleura and Head and Neck, which both tables contain, the TYK2 mean gene effect (-0.08 and -0.044) is more negative than the JAK2 mean (0.075 and 0.074).
Where they are alike. Neither gene is common essential. Both have only a small fraction of dependent lines overall (0.7% and 0.9%). Both have drugs at the APPROVAL stage, and three drugs appear in both lists: ruxolitinib, tofacitinib and tofacitinib citrate.
Drugs and selectivity. The shared drugs are the practical starting point for a JAK2 TYK2 selectivity question. Tofacitinib has a reported pChEMBL of 9.3 for JAK2 and 9.4 for TYK2, both IC50 values. These are close, and the type is the same, so the two numbers are comparable. Ruxolitinib is listed at 10.44 for JAK2 (KD) and 9.4 for TYK2 (IC50), and tofacitinib citrate at 9.22 (KD) against 8.36 (KI). Those pairs mix measurement types, so do not read the gap as a selectivity ratio without checking the underlying assays.
Deucravacitinib appears only in the TYK2 list, with the mechanism "negative allosteric modulator" and a KD-based pChEMBL of 11.1. That mechanism differs from the plain "inhibitor" labels on most other entries. The TYK2 list also includes filgotinib (8.95) and upadacitinib (8.4), both IC50.
The trial counts are by drug name, not by target. Ruxolitinib shows 281 trials in both lists, which shows the count does not depend on which gene you asked about.
How to reproduce it in BioQ
- Open BioQ and enter the query below for the first gene.
- Read the dependency by lineage block and note the cell line counts and the dependent counts.
- Open the drugs block for the same gene and note the number of drugs and the max clinical stage.
- Repeat the query with TYK2 in place of JAK2 and compare the blocks.
JAK2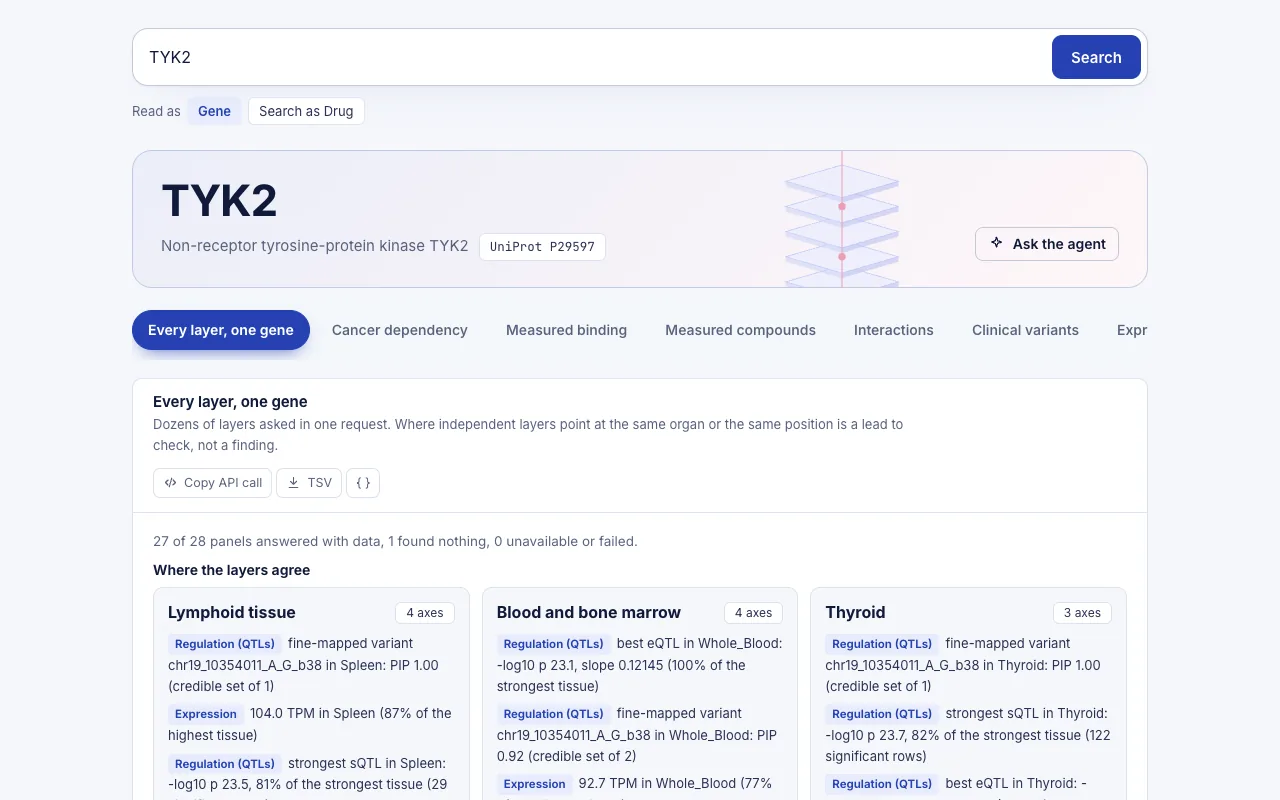
Each answer names its source (DepMap release, Open Targets, ChEMBL and the other layers), so you can check any row against the original resource.
Limits: what the data do not show
- Cell lines are not patients. A Chronos gene effect measures loss of viability after knockout in cultured lines. It says nothing about response to a drug in a person.
- The dependency threshold is a convention. The count of dependent lines changes if the cut-off changes. The 8 and 11 reflect one named constant in depmap_24q4.
- Only five lineages per gene are shown. The TYK2 total of 11 dependent lines is larger than the sum visible in its top-5 table, so some dependent lines sit in lineages not shown. The two tables are also ranked differently, so the lineages overlap only partly.
- Potency values are heterogeneous. The pChEMBL column mixes KD, IC50 and KI. The facts give one exact value per drug and gene, not a full assay panel, so they cannot establish selectivity on their own.
- Only 6 drugs per gene are shown of 47 and 20 listed. Trial counts are matched by name and say nothing about indication or outcome.
- A knockout is not an inhibitor. A drug that blocks a kinase, or modulates it allosterically, need not mimic gene loss. These data give no medical guidance.
Data and method
The numbers on this page were read from the BioQ engine on 2026-11-14 (4 queries, 0.6 s of engine time in total). The tables are generated by code from the engine's answers; the text only restates them.
/depmap, /drugs
Run the same query yourself: JAK2
For research use only. This page summarises public data and is not medical advice.
BioQ is an AI search engine and agent with one goal: making biology research 100X faster. Ask in the web app, over the REST API, or from Claude, ChatGPT or Cursor through MCP.
Queries used
Frequently asked questions
How many cell lines depend on JAK2 compared with TYK2 in DepMap?
In depmap_24q4, 8 of 1178 cell lines are dependent on JAK2 (0.7%) and 11 of 1178 on TYK2 (0.9%). Neither gene is flagged as common essential.
Is JAK2 dependency restricted to one lineage?
In this release, all 8 JAK2-dependent lines are in the Myeloid lineage, where 8 of 42 lines (19.1%) are dependent. The other four lineages in the top-5 table have 0 dependent lines.
Which drugs are known for both JAK2 and TYK2?
Ruxolitinib, tofacitinib and tofacitinib citrate appear in both lists. Deucravacitinib appears only in the TYK2 list, as a negative allosteric modulator with a KD-based pChEMBL of 11.1.
How many drugs are listed for JAK2 and TYK2?
47 drugs are listed for JAK2 and 20 for TYK2. The tables show 6 of each, and the comparison draws on 2 distinct resources.
Can these numbers tell me which inhibitor is more selective for JAK2 or TYK2?
Not on their own. The pChEMBL values come from different measurement types (KD, IC50, KI), so a direct comparison is only sound when the type matches, as with tofacitinib at 9.3 for JAK2 and 9.4 for TYK2.
Sources
Results come from public databases as of the date shown and may change. BioQ gives research information, not medical advice.
More from the blog
MDM2 vs MDM4: dependency and drugs side by side
MDM2 vs MDM4 in DepMap 24q4 Chronos data and drug annotations: 384 of 1178 cell lines depend on MDM2, 142 on MDM4; 12 drugs listed for MDM2, 1 for MDM4.
CD4 new study: CAR-NK cells and HIV rebound in context
A CD4-based CAR-NK paper on HIV rebound, placed in context with BioQ data on CD4: DepMap dependency, Open Targets diseases, drugs and Reactome pathways.
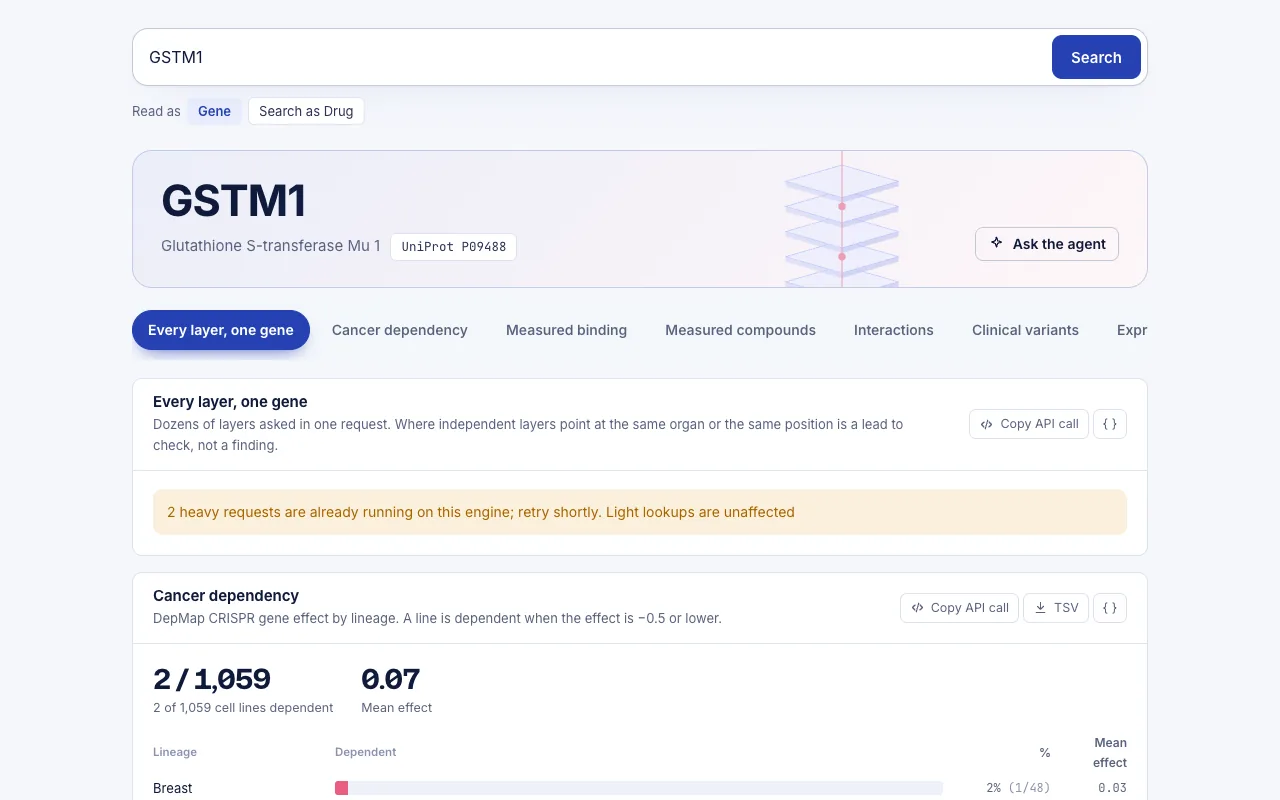
GSTM1 new study: cisplatin kidney injury in context
A 2026 paper links GSTM1 loss to worse cisplatin kidney injury; BioQ shows what DepMap, Open Targets, ChEMBL, Reactome and STRING say about GSTM1 today.