

Gene drug pair binding measurements: EGFR, gefitinib
One query, EGFR gefitinib, returns IC50 binding measurements, trial counts and CIViC evidence for the pair from three resources, as of 2026-11-06.
Data as of November 6, 2026 · By the BioQ team
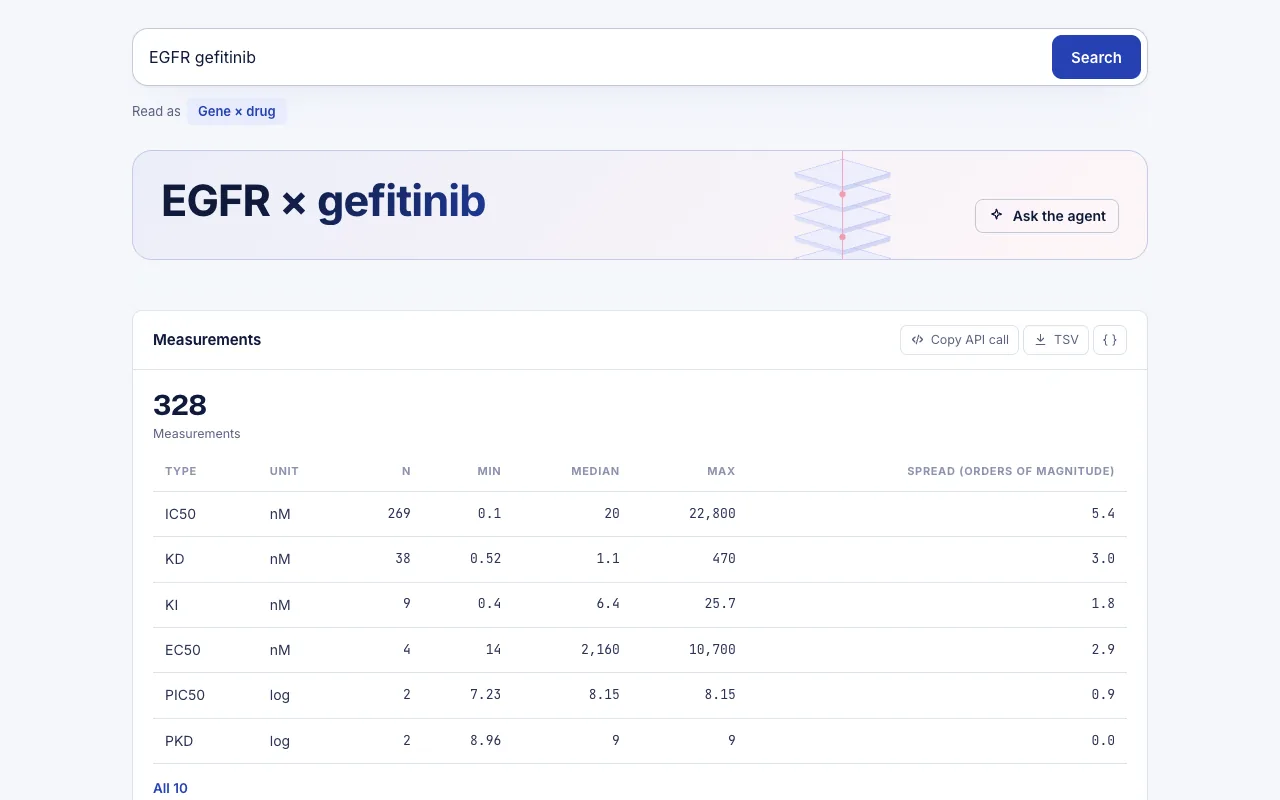
For the pair EGFR and gefitinib, the single query "EGFR gefitinib" returned 270 IC50 measurements, 214 registered gefitinib trials and 286 CIViC evidence records for EGFR. Each block names its source, and the three blocks ran in 1.51 seconds of engine time. All numbers are as of 2026-11-06. This how-to shows how to get gene drug pair binding measurements and what to check before using them.
What we asked
The task is common: you have a kinase and an inhibitor and want to know what is on record for them together. In practice that breaks into three questions.
- What potency values have been measured for this compound against this target?
- Which clinical studies of the compound are registered?
- Which EGFR variants have curated evidence that mentions the compound?
The manual route is to open a bioactivity database such as ChEMBL or BindingDB and filter by target and compound. You then open ClinicalTrials.gov and search the intervention name. Finally you open CIViC and browse the gene page for variants. Each site has its own identifiers, filters and export formats, and you reconcile them by hand.
In BioQ you type the gene symbol and the drug name as one query: EGFR gefitinib. The engine splits it into the three lookups above. In this run that was 3 engine queries, drawing on 3 distinct resources, in 1.51 seconds of engine time. We make no claim about how long the manual route takes, since that depends on the person.
What BioQ returned: gene drug pair binding measurements and context
The first block holds the measurements. It is filtered to IC50 and capped at a page of 8 rows. The header reports 270 matching measurements in total, so the table below is a page of the matches, not a ranking.
| Compound | Type | Value | Unit | Assay type | Source |
|---|---|---|---|---|---|
| gefitinib | IC50 | 0.1 | nM | B | chembl |
| gefitinib | IC50 | 0.1 | nM | B | chembl |
| gefitinib | IC50 | 0.1 | nM | B | chembl |
| gefitinib | IC50 | 0.1 | nM | A | chembl |
| gefitinib | IC50 | 0.15 | nM | B | chembl |
| gefitinib | IC50 | 0.17 | nM | B | chembl |
| gefitinib | IC50 | 0.2 | nM | B | chembl |
| gefitinib | IC50 | 0.2 | nM | B | chembl |
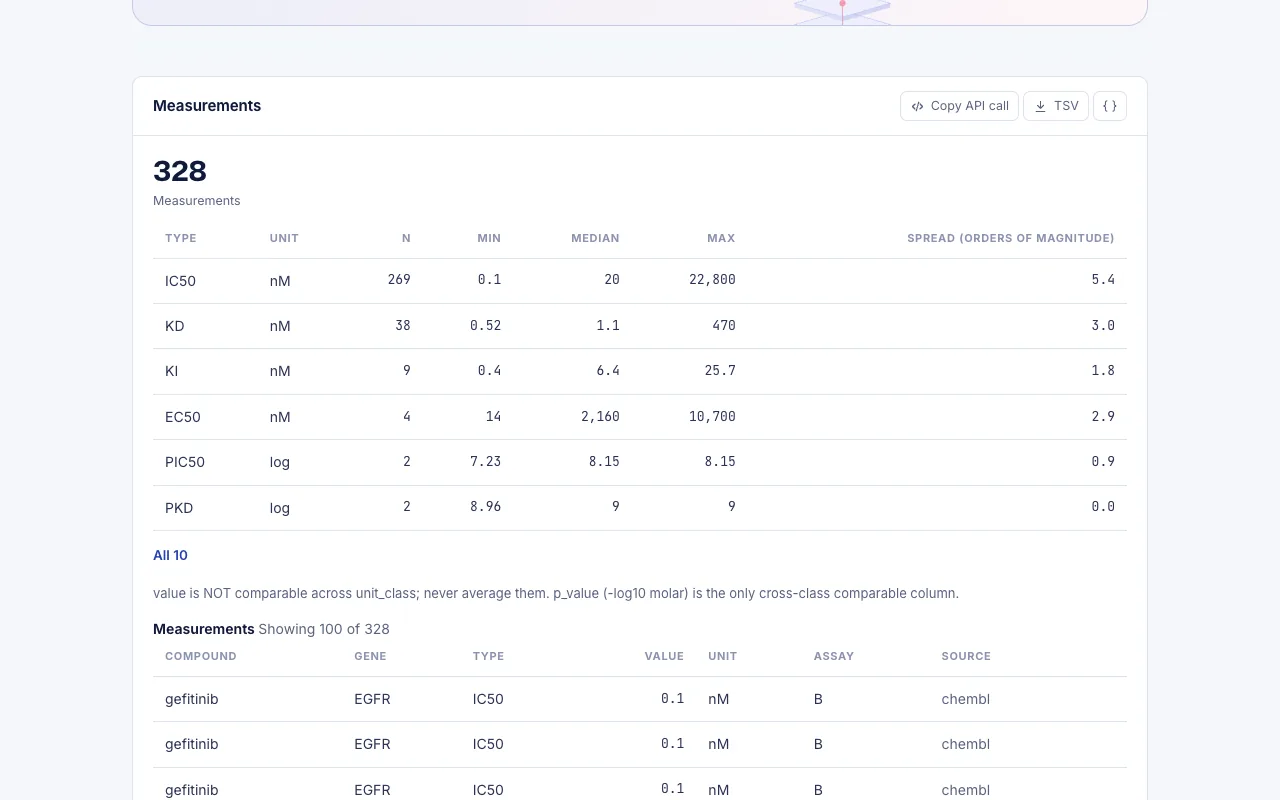
On this page, all 8 rows are gefitinib IC50 values in nM, and all come from ChEMBL. They run from 0.1 to 0.2 nM, with four rows at 0.1. The route searches ChEMBL, DrugCentral, Guide to Pharmacology and BindingDB, so rows from other sources can appear on other pages.
The second block counts registered trials of gefitinib. It reports 214 studies: 43 in phase 1, 140 in phase 2 and 40 in phase 3. The table shows 5 of them.
| Trial | Phase | Status | Sponsor | Start | Enrollment |
|---|---|---|---|---|---|
| NCT00333294 | PHASE2 | COMPLETED | AstraZeneca | 2004-09 | 50 |
| NCT00075439 | PHASE2 | COMPLETED | National Cancer Institute (NCI) | 2003-12 | 90 |
| NCT00080743 | PHASE2 | COMPLETED | Dartmouth-Hitchcock Medical Center | 2004-01 | 2 |
| NCT03602027 | NA | UNKNOWN | Second Affiliated Hospital of Nanchang U | 2018-08 | 9 |
| NCT00076388 | PHASE3 | COMPLETED | AstraZeneca | 2004-02 | 1440 |
The third block is CIViC evidence for EGFR. It holds 286 records, and 5 are shown.
| Molecular profile | Disease | Therapies | Evidence level | Significance |
|---|---|---|---|---|
| EGFR L858R | Lung Non-small Cell Carcinoma | Gefitinib, Erlotinib | B | Sensitivity/Response |
| EGFR T790M | Lung Non-small Cell Carcinoma | Erlotinib | A | Resistance |
| EGFR T790M | Lung Non-small Cell Carcinoma | Gefitinib | B | Resistance |
| EGFR T790M | Lung Non-small Cell Carcinoma | Dacomitinib | B | Resistance |
| EGFR Exon 19 Deletion | Lung Non-small Cell Carcinoma | Gefitinib | D | Sensitivity/Response |
What it means and how to read it
Measurements. A potency table for one pair is a set of separate experiments, not one number. Rows differ by assay format, cell line or enzyme construct, and the source's one-letter assay type code. Before you quote an IC50 for EGFR and gefitinib, open the underlying records and check what was measured. In particular, check whether the target was wild type or a mutant form. The page here does not show that, and a value at 0.1 nM and one at 0.2 nM can come from very different setups. Keep the total of 270 in mind as well. Eight rows are a sample of the matches, so do not summarise the whole set from them.
Trials. The phase counts tell you how the registered work is distributed, not what it found. The five rows include a phase 3 study with an enrollment of 1440 and a phase 2 study with an enrollment of 2. That is a reminder that registry records vary widely in size. Status values such as COMPLETED or UNKNOWN describe the registry entry, not the outcome.
CIViC evidence. The rows connect the gene-level question to variants. EGFR L858R appears with Gefitinib and Erlotinib at evidence level B, with the significance Sensitivity/Response. EGFR T790M appears with Gefitinib at level B, with the significance Resistance. EGFR Exon 19 Deletion appears with Gefitinib at level D, as Sensitivity/Response. Levels run from A to E, with A the strongest. If your question is about EGFR L858R sensitivity, this block points you to the curated evidence items to read. It does not replace reading them.
Next steps. A reasonable follow-up is to narrow the measurement query to your variant or assay of interest. You can also open the CIViC items behind the rows that matter to you. Or you can pull the full list of trials and filter by phase.
How to reproduce it in BioQ
- Open BioQ and place the cursor in the search box.
- Enter the gene symbol and the drug name, separated by a space, exactly as below.
EGFR gefitinib- Read the measurements block first. Note the total count above the table, then check the units and the assay type column in the rows shown.
- Scroll to the trials block and read the phase counts, then open the NCT identifiers that match your interest.
- Check the CIViC block for the variant you work with, and note the evidence level and the significance.
- Use the source label on each block to go to the original record when you need to cite it.
Limits: what the data do not show
- The measurement table is one page of 270 matches. It is not sorted by quality and is not a ranking of potency.
- IC50 values from different assays are not directly comparable. The page does not tell you the cell line, the EGFR form or the assay conditions.
- Only IC50 was requested here. Other measurement types, such as Ki or Kd, are not in this result.
- The trial counts describe registrations, not results. They say nothing about whether a study showed benefit.
- CIViC evidence levels rate the strength of curated evidence, not the size of an effect, and 5 of 286 records are shown.
- Nothing here is guidance for treatment or dosing.
- The data are as of 2026-11-06 and will change as the underlying resources update.
Data and method
The numbers on this page were read from the BioQ engine on 2026-11-06 (3 queries, 1.5 s of engine time in total). The tables are generated by code from the engine's answers; the text only restates them.
/affinity, /civic, /clinicaltrials
Run the same query yourself: EGFR gefitinib
For research use only. This page summarises public data and is not medical advice.
BioQ is an AI search engine and agent with one goal: making biology research 100X faster. Ask in the web app, over the REST API, or from Claude, ChatGPT or Cursor through MCP.
Queries used
Frequently asked questions
How many IC50 measurements exist for EGFR and gefitinib?
The query returned 270 matching IC50 measurements as of 2026-11-06. The table shows a page of 8, which is not a ranking of the 270.
How many gefitinib trials are registered?
The ClinicalTrials.gov block reports 214 studies: 43 in phase 1, 140 in phase 2 and 40 in phase 3. The table lists 5 of them.
What does CIViC say about EGFR L858R and gefitinib?
CIViC lists EGFR L858R in Lung Non-small Cell Carcinoma with Gefitinib and Erlotinib at evidence level B, with the significance Sensitivity/Response. The EGFR gene has 286 records in total, and 5 are shown.
How long did the lookup take?
The engine ran 3 queries across 3 distinct resources in 1.51 seconds in total. This is engine time only and does not include reading the results.
Can I compare the IC50 values in the table directly?
Not without checking the assays. The 8 rows shown range from 0.1 to 0.2 nM, but the page does not show the cell line, the EGFR form or the assay conditions behind each value.
Sources
Results come from public databases as of the date shown and may change. BioQ gives research information, not medical advice.
More from the blog
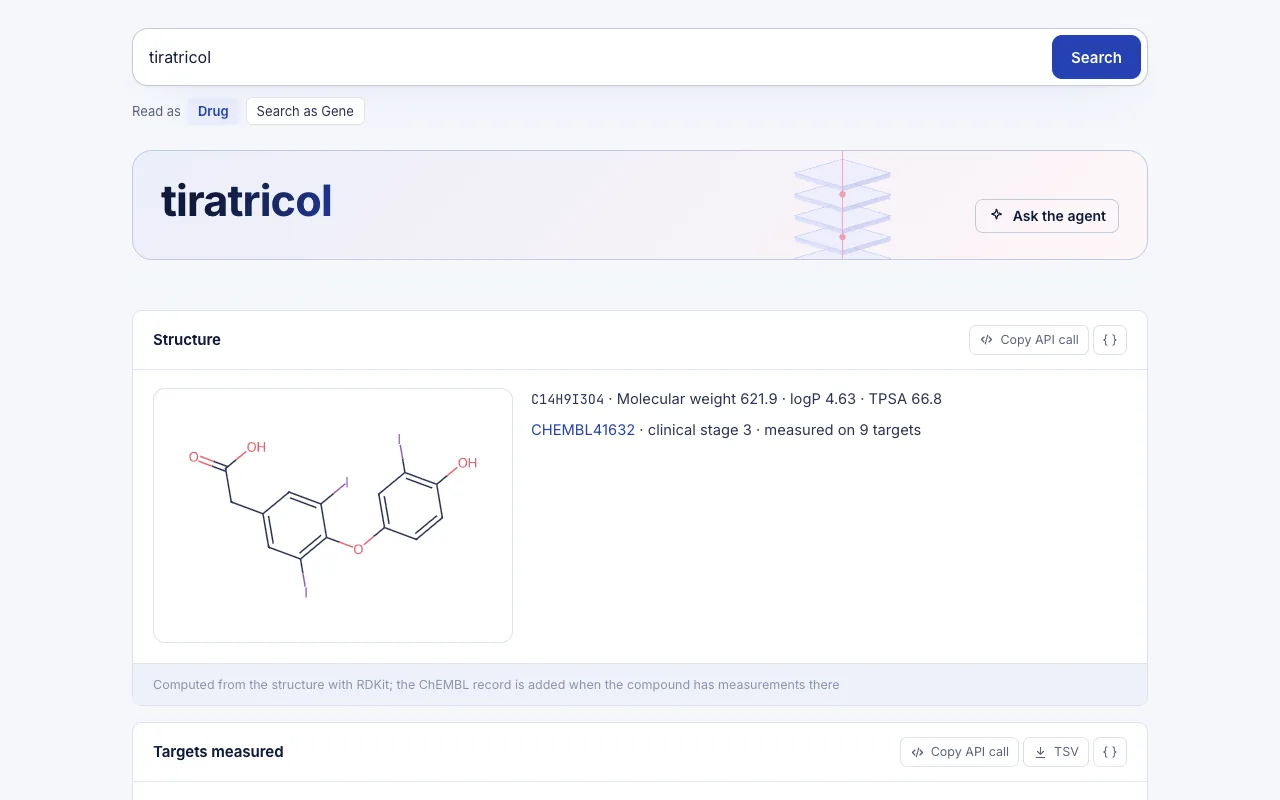
Tiratricol FDA approval: targets and potency in BioQ
Tiratricol FDA approval (Emcitate): ChEMBL shows 68 targets, THRB and THRA top by pChEMBL, and 3 registered trials on ClinicalTrials.gov, as of 2026-11-17.
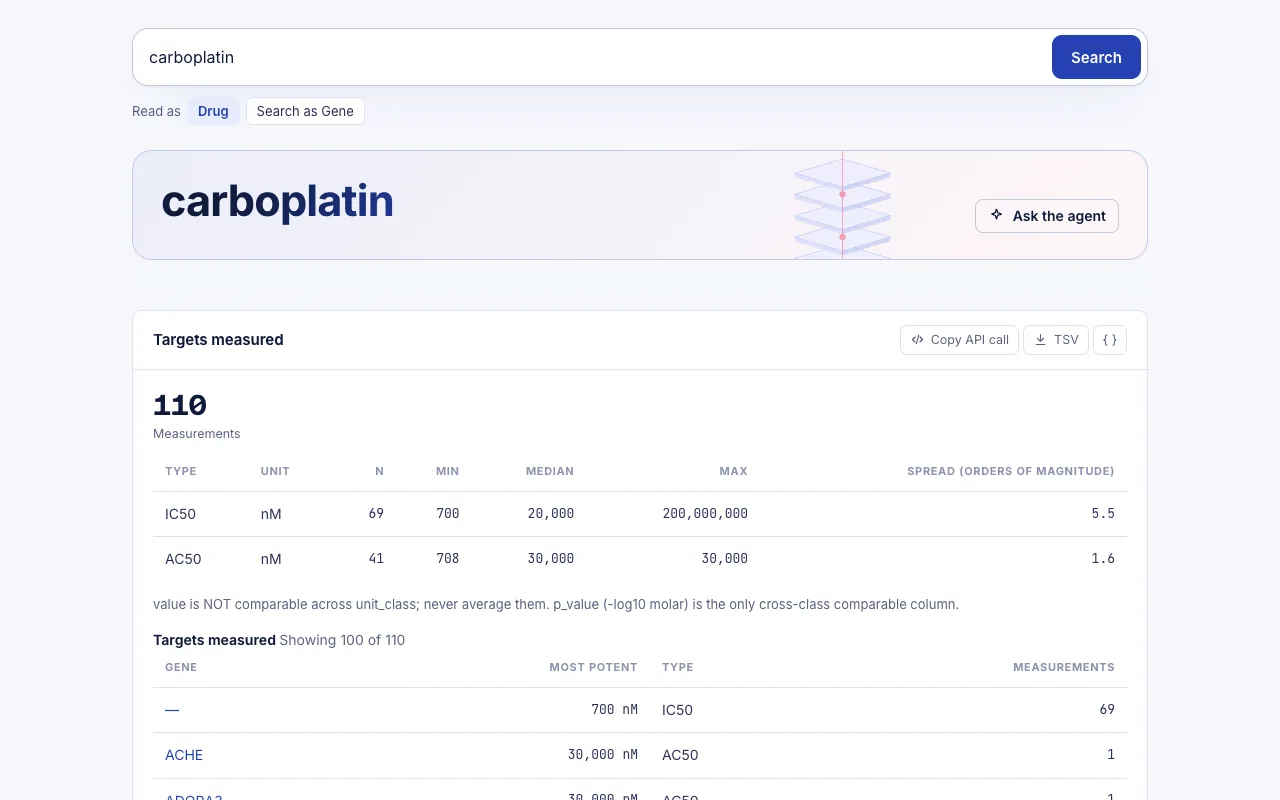
Carboplatin Non-Small Cell Lung Cancer trial: NCT07877584
NCT07877584 is a phase 3 NSCLC trial of PD-1 blockade with or without chemotherapy; BioQ adds carboplatin ChEMBL potency and ClinicalTrials.gov context.
Semaglutide new study: what BioQ data show
A new FAERS paper on semaglutide and panic attacks, set against ChEMBL potency, ClinicalTrials.gov registrations and PubChem identity as of 2026-11-15.