

NTRK1 dependency and drugs in one query
NTRK1 shows 1 dependent line of 1178 in DepMap, yet 26 drugs and 2563 disease links in Open Targets; one BioQ query joins 7 resources as of 2026-11-06.
Data as of November 6, 2026 · By the BioQ team
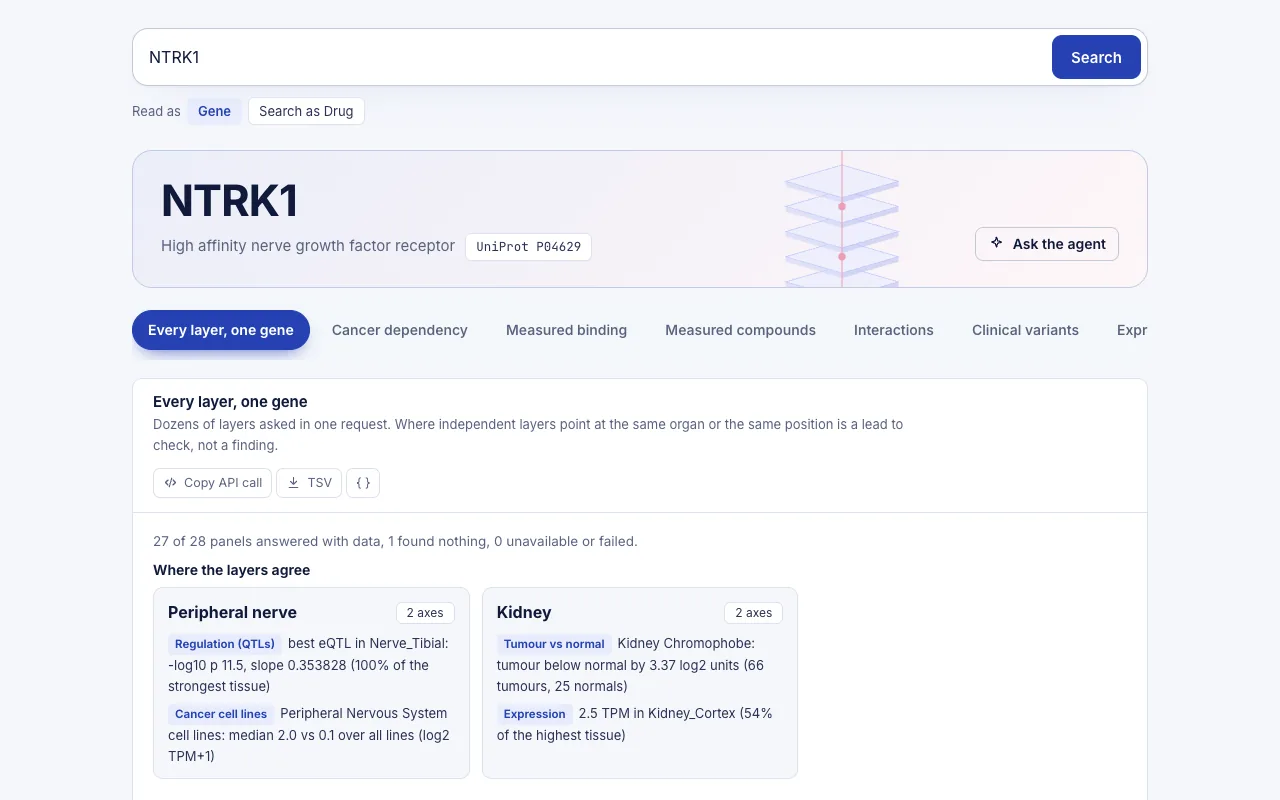
Across 1178 cell lines in DepMap, only 1 depends on NTRK1 (0.1%), and the mean Chronos gene effect is -0.03. Yet 26 drugs are linked to the gene and Open Targets lists 2563 associated diseases. All figures are as of 2026-11-06. The layers disagree on the surface, and the CIViC fusion records help explain why.
What we asked: NTRK1 dependency and drugs in one query
The question was broad: what do the public data layers say about NTRK1 today? We wanted to know whether knocking out the gene hurts cell lines, which drugs act on it and how potent they are, which diseases carry evidence, and how the gene is expressed and wired into pathways.
We typed only the gene symbol, NTRK1, into BioQ. The engine ran 7 queries against 7 distinct resources: DepMap, Open Targets, ChEMBL, ClinicalTrials.gov, TCGA/GTEx, CIViC, Reactome and STRING, with the drug block combining several of them. The engine time was 0.63 seconds in total. Collecting the same layers by hand means visiting each resource, matching identifiers and reading each release note. Reading the results still takes your time, but the retrieval does not.
What BioQ returned
Dependency. The DepMap block reports Chronos gene effect from release depmap_24q4. A more negative value means the knockout reduced viability more. A line counts as dependent when its effect falls at or below a named cut-off, which is a convention and not a property of the data. NTRK1 is not flagged as common essential.
| Lineage | Cell lines | Dependent | % dependent | Mean gene effect |
|---|---|---|---|---|
| Bladder/Urinary Tract | 34 | 0 | 0 | -0.058 |
| Testis | 5 | 0 | 0 | -0.056 |
| Kidney | 34 | 0 | 0 | -0.052 |
| Bowel | 63 | 0 | 0 | -0.048 |
| Cervix | 18 | 0 | 0 | -0.047 |
| Pleura | 21 | 0 | 0 | -0.042 |
| Lung | 126 | 1 | 0.8 | -0.04 |
| Soft Tissue | 45 | 0 | 0 | -0.04 |
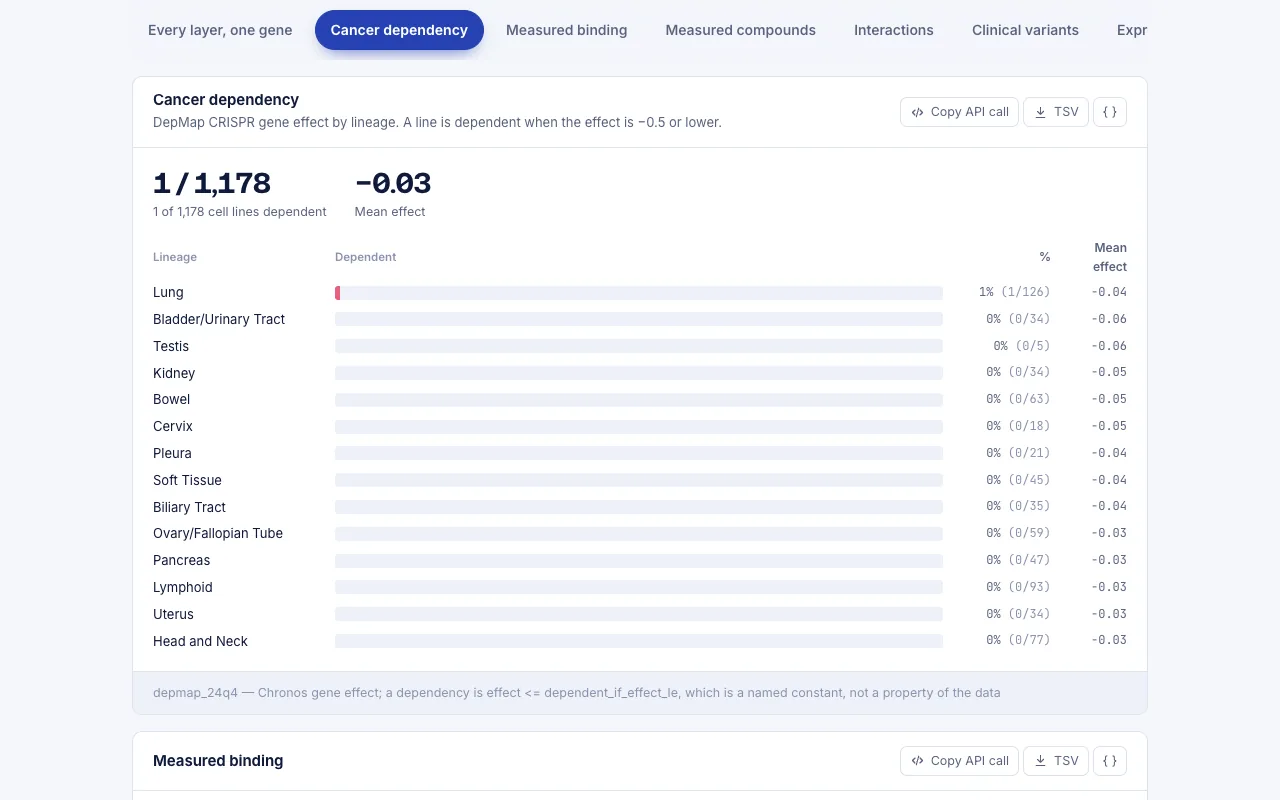
The single dependent line sits in the lung lineage, which has 126 lines (0.8% dependent). Every other lineage shown has none.
Drugs. The drug block pulls from Open Targets, ChEMBL, the Drug Repurposing Hub and ClinicalTrials.gov. It lists 26 drugs for NTRK1 and shows 8.
| Drug | Max clinical stage | Mechanism | Best exact pChEMBL | Type | Trials by name |
|---|---|---|---|---|---|
| Repotrectinib | APPROVAL | Nerve growth factor receptor Trk-A inhibitor | 9.96 | IC50 | 12 |
| Entrectinib | APPROVAL | Neurotrophic tyrosine kinase receptor inhibitor | 9.66 | IC50 | 33 |
| Larotrectinib | APPROVAL | Neurotrophic tyrosine kinase receptor inhibitor | 9.4 | IC50 | 9 |
| Larotrectinib Sulfate | APPROVAL | Neurotrophic tyrosine kinase receptor inhibitor | 8.7 | IC50 | 5 |
| Amitriptyline | APPROVAL | — | 4.22 | IC50 | 71 |
| Cenegermin | APPROVAL | Neurotrophic tyrosine kinase receptor agonist | — | — | 3 |
| Imatinib | APPROVAL | — | — | — | 151 |
| Regorafenib | APPROVAL | Nerve growth factor receptor Trk-A inhibitor | — | — | 182 |
The three Trk-directed approvals with exact IC50 values are repotrectinib (pChEMBL 9.96), entrectinib (9.66) and larotrectinib (9.4). Larotrectinib Sulfate, the salt form, is listed separately at 8.7. Amitriptyline also appears, with an exact IC50 of 4.22. That is a far weaker potency on this scale, where higher is stronger. Cenegermin is annotated as an agonist, so it is not an inhibitor.
Disease evidence. Open Targets links NTRK1 to 2563 diseases.
| Disease | Association score | Evidence items |
|---|---|---|
| hereditary sensory and autonomic neuropathy type 4 | 0.857 | 1500 |
| non-small cell lung carcinoma | 0.656 | 1094 |
| neoplasm | 0.633 | 5149 |
| cancer | 0.612 | 4396 |
| colorectal cancer | 0.578 | 342 |
| familial medullary thyroid carcinoma | 0.566 | 30 |
The top association is hereditary sensory and autonomic neuropathy type 4 (score 0.857, 1500 evidence items). Non-small cell lung carcinoma follows at 0.656. Familial medullary thyroid carcinoma scores 0.566 on only 30 evidence items.
Clinical variant evidence, expression and pathways. CIViC holds 84 records for NTRK1. Among the 5 shown, the rows are mostly fusions: a TPM3::NTRK1 fusion in colorectal cancer (level D, with lestaurtinib and larotrectinib), a SQSTM1::NTRK1 fusion in lung non-small cell carcinoma (level C, entrectinib), and an NTRK1 fusion in solid tumour with entrectinib at level A, the strongest level. NTRK1 overexpression in neuroblastoma is listed at level B as "Better Outcome".
TCGA/GTEx expression can be compared in 24 cancer types that have both tumour and normal samples. Pheochromocytoma and paraganglioma show a mean of 11.22 in tumours against 5.3 in 3 normals (log2 fold 1.08). Kidney chromophobe goes the other way: 1.88 in tumours against 5.25 in normals (-1.48). Reactome assigns 17 pathways, led by TRKA activation by NGF. STRING v12 reports 2542 partners, and NGFR, NGF, NTF3, SHC1, BDNF and NTF4 all score 999.
What it means and how to read it
Three facts are worth reading together before anything else.
- The dependency is narrow. One dependent line in 1178 and a mean effect of -0.03 say that NTRK1 loss does not broadly reduce viability across the panel. This is what you would expect for a gene that matters only in particular contexts.
- The drugs and the fusion records point at such a context. The approved Trk inhibitors have pChEMBL values from 8.7 to 9.96, and the CIViC rows tie sensitivity to NTRK1 fusions, not to the wild-type gene. A reasonable reading is that a general knockout screen would show little, while a fusion-driven tumour could respond to inhibition. The data here are consistent with that reading. They do not prove it.
- The disease ranking reflects a different biology. The top Open Targets disease is a neuropathy, which is a germline condition, not a cancer. The score depends on how much and what kind of evidence has been collected, so it should not be read as a ranking of therapeutic relevance.
The expression data add a caution. Mean tumour expression differs from normal in both directions across cancer types, and none of those comparisons is stratified by fusion status. Low or high expression therefore does not tell you whether a fusion is present. The STRING scores of 999 describe confidence that two proteins are functionally associated. They do not show direct binding, and the top partners are the expected neurotrophin ligands and an adaptor.
Also be careful with the "Trials by name" column. It counts trial records that mention a drug name, not trials directed at NTRK1. That is why imatinib (151) and amitriptyline (71) show large numbers despite weak or absent Trk-specific potency in this table.
How to reproduce it in BioQ
- Open BioQ and make sure you are on the search page.
- Enter the gene symbol exactly as below, with nothing else.
- Read the dependency block first, then the drug and CIViC blocks, and compare the lineage table with the fusion rows.
- Check the data release shown under each block, since the numbers above are as of 2026-11-06.
NTRK1- Open any block to see its named source, then narrow the question, for example to one lineage or one drug.
Limits: what the data do not show
- The DepMap panel does not tell you whether any cell line carries an NTRK1 fusion in this result. The near-absence of dependency cannot be read as absence of fusion-driven dependency.
- The dependent-line count depends on a chosen cut-off. A different threshold would change the count.
- pChEMBL values come from different assays and labs. They compare potency in vitro and say nothing about dosing, tolerability or patient benefit.
- Trial counts are matched by drug name and include trials unrelated to NTRK1.
- CIViC evidence levels rank the type of evidence, not the size of a response. Most rows shown are below level A.
- Open Targets scores measure evidence volume and type, not causality.
- TCGA/GTEx comparisons use some very small normal groups, such as 3 normals in pheochromocytoma and paraganglioma, so those fold changes are fragile.
- Only the top rows of each block are shown. The full lists are longer, for example 26 drugs and 17 pathways.
Data and method
The numbers on this page were read from the BioQ engine on 2026-11-06 (7 queries, 0.6 s of engine time in total). The tables are generated by code from the engine's answers; the text only restates them.
/civic, /depmap, /drugs, /interaction, /ot_association, /pathway, /tcga
Run the same query yourself: NTRK1
For research use only. This page summarises public data and is not medical advice.
BioQ is an AI search engine and agent with one goal: making biology research 100X faster. Ask in the web app, over the REST API, or from Claude, ChatGPT or Cursor through MCP.
Queries used
Frequently asked questions
Is NTRK1 a common essential gene in DepMap?
No. In DepMap release depmap_24q4, NTRK1 is not flagged as common essential. Only 1 of 1178 cell lines is dependent (0.1%), and the mean Chronos gene effect is -0.03.
Which NTRK1 inhibitors have the highest exact potency in ChEMBL?
Among the drugs shown, repotrectinib has the highest exact pChEMBL at 9.96 (IC50), followed by entrectinib at 9.66 and larotrectinib at 9.4. These are in vitro potency values and do not describe clinical outcome.
How many diseases does Open Targets associate with NTRK1?
Open Targets lists 2563 diseases. The top association is hereditary sensory and autonomic neuropathy type 4 with a score of 0.857 and 1500 evidence items, followed by non-small cell lung carcinoma at 0.656.
What clinical evidence does CIViC hold for NTRK1?
CIViC has 84 records for NTRK1. The rows shown are mostly fusions, including an NTRK1 fusion in solid tumour with entrectinib at evidence level A.
How long does the combined NTRK1 query take?
The engine ran 7 queries across 7 distinct resources in 0.63 seconds in total. That covers retrieval only, not the time you spend reading the results.
Sources
- Dataset DepMap CRISPR Chronos gene effect (24Q4)
- Dataset Open Targets Platform; ChEMBL; Drug Repurposing Hub
- Dataset TCGA pan-cancer expression (UCSC Xena Toil recompute)
- Dataset CIViC: Clinical Interpretation of Variants in Cancer
- Dataset Reactome pathway knowledgebase
- Dataset STRING v12 protein-protein interactions
Results come from public databases as of the date shown and may change. BioQ gives research information, not medical advice.
More from the blog
CD4 new study: CAR-NK cells and HIV rebound in context
A CD4-based CAR-NK paper on HIV rebound, placed in context with BioQ data on CD4: DepMap dependency, Open Targets diseases, drugs and Reactome pathways.
GSTM1 new study: cisplatin kidney injury in context
A 2026 paper links GSTM1 loss to worse cisplatin kidney injury; BioQ shows what DepMap, Open Targets, ChEMBL, Reactome and STRING say about GSTM1 today.
JAK2 vs TYK2: dependency and drugs side by side
JAK2 vs TYK2 in DepMap and drug databases: 8 of 1178 cell lines are dependent on JAK2, 11 on TYK2; 47 drugs are known for JAK2 and 20 for TYK2.