

BTK vs ITK: CRISPR dependency and drugs compared
BTK vs ITK compared in DepMap Chronos data and drug annotations: BTK is a dependency in 5 of 1178 cell lines, ITK in none; 30 drugs versus 4 listed.
Data as of November 12, 2026 · By the BioQ team
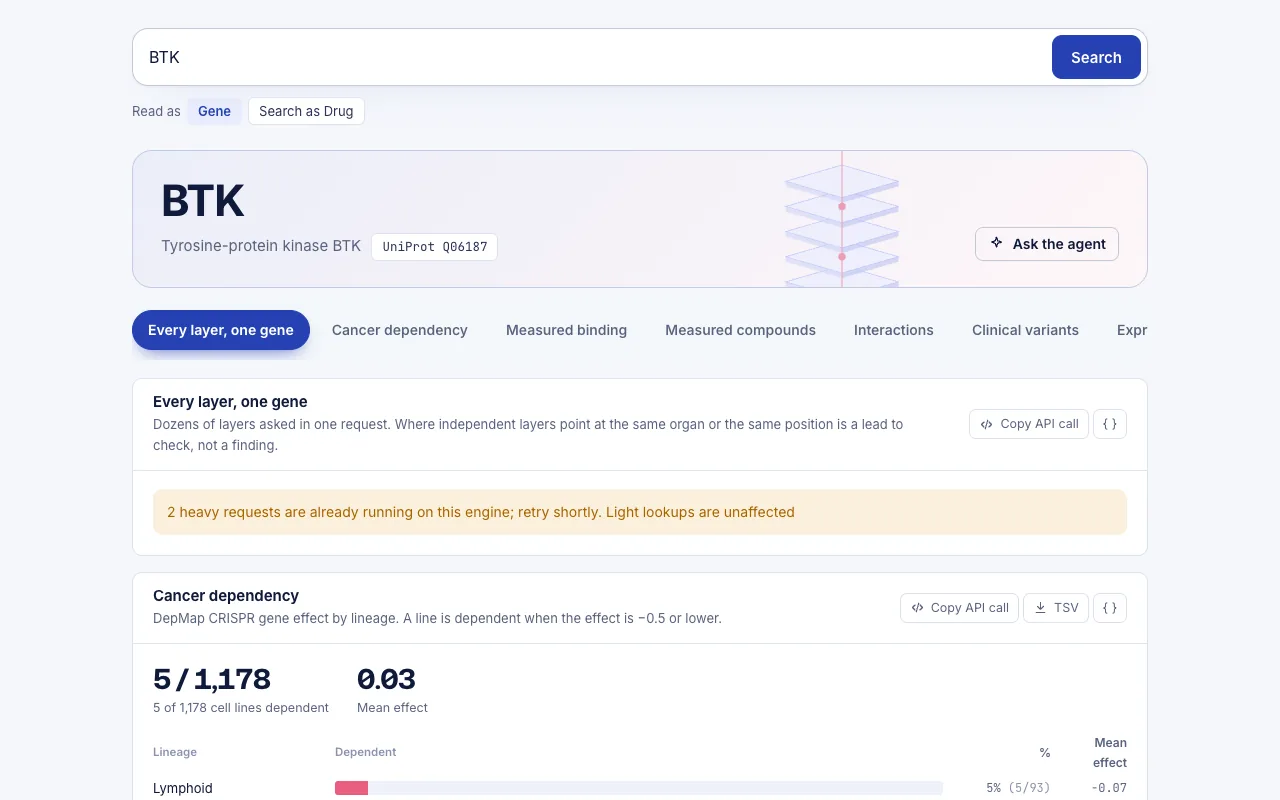
In DepMap release depmap_24q4, BTK is a dependency in 5 of 1178 cell lines, all of them lymphoid, while its paralog ITK is a dependency in 0. The drug layer lists 30 drugs for BTK and 4 for ITK. All figures are as of 2026-11-12.
What we asked: BTK vs ITK in dependency and drugs
BTK and ITK are both TEC family tyrosine kinases. Researchers often compare them for two reasons: whether cancer cell lines need either gene for growth, and whether the available drugs reach one kinase or both. This is the usual starting point for a BTK ITK selectivity question.
We asked BioQ the same two questions for each gene:
- In which lineages does CRISPR knockout lower viability? This uses the Chronos gene effect from DepMap, where a more negative value means a larger loss of viability.
- Which drugs are annotated against the gene, at what clinical stage, and with what exact potency (pChEMBL, the negative log10 of molar potency, where higher is stronger)?
Using the same blocks for both genes keeps the comparison fair. The lineage cut-off for calling a line dependent is a named constant in the release, not a property of the data.
What BioQ returned
The four blocks came back in 2.4 engine seconds across 4 queries, drawing on 2 distinct resources: DepMap for dependency, and the drug layer, which merges Open Targets, ChEMBL, the Drug Repurposing Hub and ClinicalTrials.gov.
Dependency by lineage
Both genes were screened in the same 1178 cell lines. The tables show the five lineages with the most negative mean gene effect.
BTK:
| Lineage | Cell lines | Dependent | % dependent | Mean gene effect |
|---|---|---|---|---|
| Lymphoid | 93 | 5 | 5.4 | -0.065 |
| Testis | 5 | 0 | 0 | -0.054 |
| Bowel | 63 | 0 | 0 | 0.011 |
| Head and Neck | 77 | 0 | 0 | 0.011 |
| Pleura | 21 | 0 | 0 | 0.015 |
ITK:
| Lineage | Cell lines | Dependent | % dependent | Mean gene effect |
|---|---|---|---|---|
| Kidney | 34 | 0 | 0 | -0.01 |
| Lymphoid | 93 | 0 | 0 | -0.001 |
| Liver | 24 | 0 | 0 | 0.004 |
| Bone | 46 | 0 | 0 | 0.006 |
| Bowel | 63 | 0 | 0 | 0.014 |
Across all lines, the mean gene effect is 0.033 for BTK and 0.024 for ITK. Neither gene is flagged as common essential.
Drugs
BTK has 30 drugs in the layer, and the table shows 6. ITK has 4, all of which are shown in the prose below.
| Drug | Max clinical stage | Mechanism | Best exact pChEMBL | Type | Trials by name |
|---|---|---|---|---|---|
| Ibrutinib | APPROVAL | Tyrosine-protein kinase BTK inhibitor | 10.1 | IC50 | 284 |
| Zanubrutinib | APPROVAL | Tyrosine-protein kinase BTK inhibitor | 9.52 | IC50 | 140 |
| Rilzabrutinib | APPROVAL | Tyrosine-protein kinase BTK inhibitor | 8.89 | IC50 | 18 |
| Acalabrutinib | APPROVAL | Tyrosine-protein kinase BTK inhibitor | 8.59 | KD | 121 |
| Pirtobrutinib | APPROVAL | Tyrosine-protein kinase BTK inhibitor | 8.43 | IC50 | 64 |
| Tirabrutinib | APPROVAL | Tyrosine-protein kinase BTK inhibitor | 8.28 | IC50 | 12 |
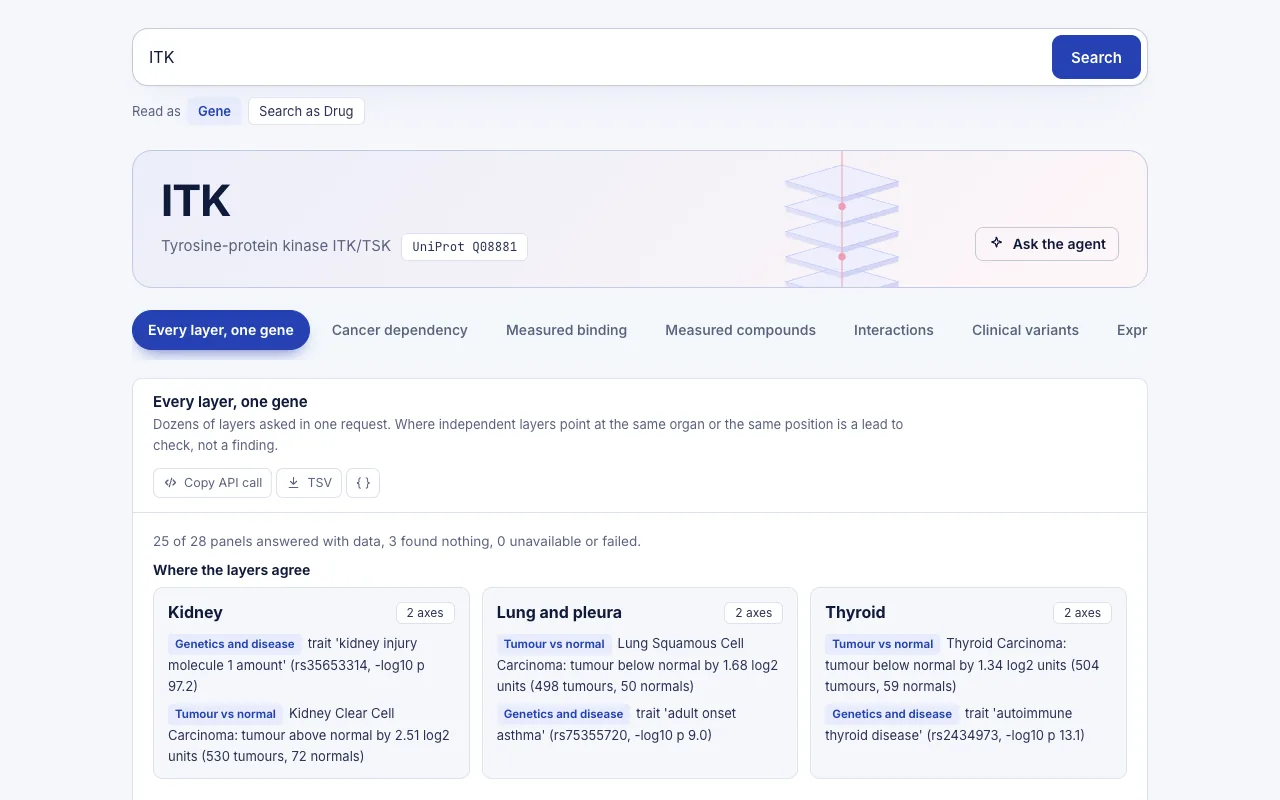
For ITK, the four entries are ritlecitinib, ritlecitinib tosylate, pazopanib and pazopanib hydrochloride. All four are at the APPROVAL stage. Ritlecitinib has an exact pChEMBL of 7.57 (type KI) and 21 trials by name. Pazopanib is annotated as a tyrosine-protein kinase ITK/TSK inhibitor with 156 trials by name. Pazopanib hydrochloride has 44 trials by name, and ritlecitinib tosylate has 0. The two pazopanib entries and the tosylate salt have no exact pChEMBL value in this layer.
What it means and how to read it
Where they differ. The dependency signal sits with BTK. Its lymphoid row shows 5 dependent lines out of 93 (5.4%) and a mean gene effect of -0.065. The other four lineages listed for BTK have 0 dependent lines. In the same lymphoid set of 93 lines, ITK has 0 dependent lines and a mean of -0.001. ITK's five most negative lineages (kidney, lymphoid, liver, bone, bowel) all have means close to zero, from -0.01 to 0.014, and none has a dependent line.
Where they are alike. Neither gene is common essential, and both have a whole-panel mean gene effect near zero. Lymphoid and bowel lines appear in both tables with the same line counts (93 and 63). Knockout of either kinase alone is therefore a weak viability signal in most of this panel.
The drug side is lopsided. The BTK drugs shown are all at the APPROVAL stage and carry the mechanism "Tyrosine-protein kinase BTK inhibitor". Ibrutinib has an exact pChEMBL of 10.1 (IC50) and 284 trials by name. Zanubrutinib has 9.52 and 140 trials, and acalabrutinib has 8.59 (KD) and 121 trials. ITK's list is shorter, and its mechanism labels are broader. Ritlecitinib is labelled "TEC family kinase inhibitor", not ITK-specific.
Potency values are only loosely comparable here. The highest exact value for BTK (10.1, IC50) and the one for ITK (7.57, KI) come from different assay types and different compounds. The "trials by name" count is a match on the drug name, not on the target, so a pazopanib count of 156 says nothing about ITK-directed studies.
For selectivity, the paralog relationship is a reason to look at both genes, but these blocks do not contain a kinase-panel profile. They do not show how strongly any one drug hits BTK compared with ITK.
How to reproduce it in BioQ
- Open BioQ and enter the query below. The BTK dependency table and the BTK drug list appear with their sources.
BTK- Read the lineage table and note the number of dependent lines and the release name (depmap_24q4).
- Run the same query with ITK in place of BTK, so both genes are read against the same release and the same drug layer.
- Compare the two lineage tables row by row, then the drug tables, checking the assay type before comparing any pChEMBL values.
- Record the data date shown with the result so the comparison can be repeated later.
Limits: what the data do not show
- Cell-line dependency measures loss of viability in culture after knockout. It does not show whether a kinase matters in a patient tumour or in signalling that is not tied to growth, such as B-cell or T-cell receptor responses.
- Both tables show only the top 5 lineages by mean gene effect. A lineage outside that list is not shown, and the BTK drug table shows 6 of 30 drugs.
- A dependent call depends on the threshold constant. A different cut-off would change the counts of 5 and 0.
- Pooled lines per lineage can be few. Testis has 5 lines, so its mean of -0.054 should be read with caution.
- pChEMBL values mix assay types (IC50, KD, KI). Missing values for pazopanib mean no exact value is recorded here, not that none exists elsewhere.
- Nothing here is guidance on treatment or dosing.
Data and method
The numbers on this page were read from the BioQ engine on 2026-11-12 (4 queries, 2.4 s of engine time in total). The tables are generated by code from the engine's answers; the text only restates them.
/depmap, /drugs
Run the same query yourself: BTK
For research use only. This page summarises public data and is not medical advice.
BioQ is an AI search engine and agent with one goal: making biology research 100X faster. Ask in the web app, over the REST API, or from Claude, ChatGPT or Cursor through MCP.
Queries used
Frequently asked questions
Is BTK a CRISPR dependency in more cell lines than ITK?
Yes, in DepMap depmap_24q4. BTK is a dependency in 5 of 1178 cell lines (0.4%), all lymphoid, while ITK is a dependency in 0 of 1178.
Are BTK and ITK common essential genes?
No. Neither is flagged as common essential. The mean gene effect across all lines is 0.033 for BTK and 0.024 for ITK.
How many drugs are listed for BTK and for ITK?
The drug layer lists 30 drugs for BTK and 4 for ITK. The ITK entries are ritlecitinib, ritlecitinib tosylate, pazopanib and pazopanib hydrochloride.
Does this show BTK ITK selectivity of a drug?
No. The blocks give an exact pChEMBL for each drug against its listed target, such as 10.1 for ibrutinib on BTK and 7.57 for ritlecitinib on ITK. They do not give a kinase-panel comparison of one drug across both genes.
How long did the BTK and ITK comparison take in BioQ?
The 4 queries ran in 2.4 engine seconds, drawing on 2 distinct resources.
Sources
Results come from public databases as of the date shown and may change. BioQ gives research information, not medical advice.
More from the blog
MDM2 vs MDM4: dependency and drugs side by side
MDM2 vs MDM4 in DepMap 24q4 Chronos data and drug annotations: 384 of 1178 cell lines depend on MDM2, 142 on MDM4; 12 drugs listed for MDM2, 1 for MDM4.
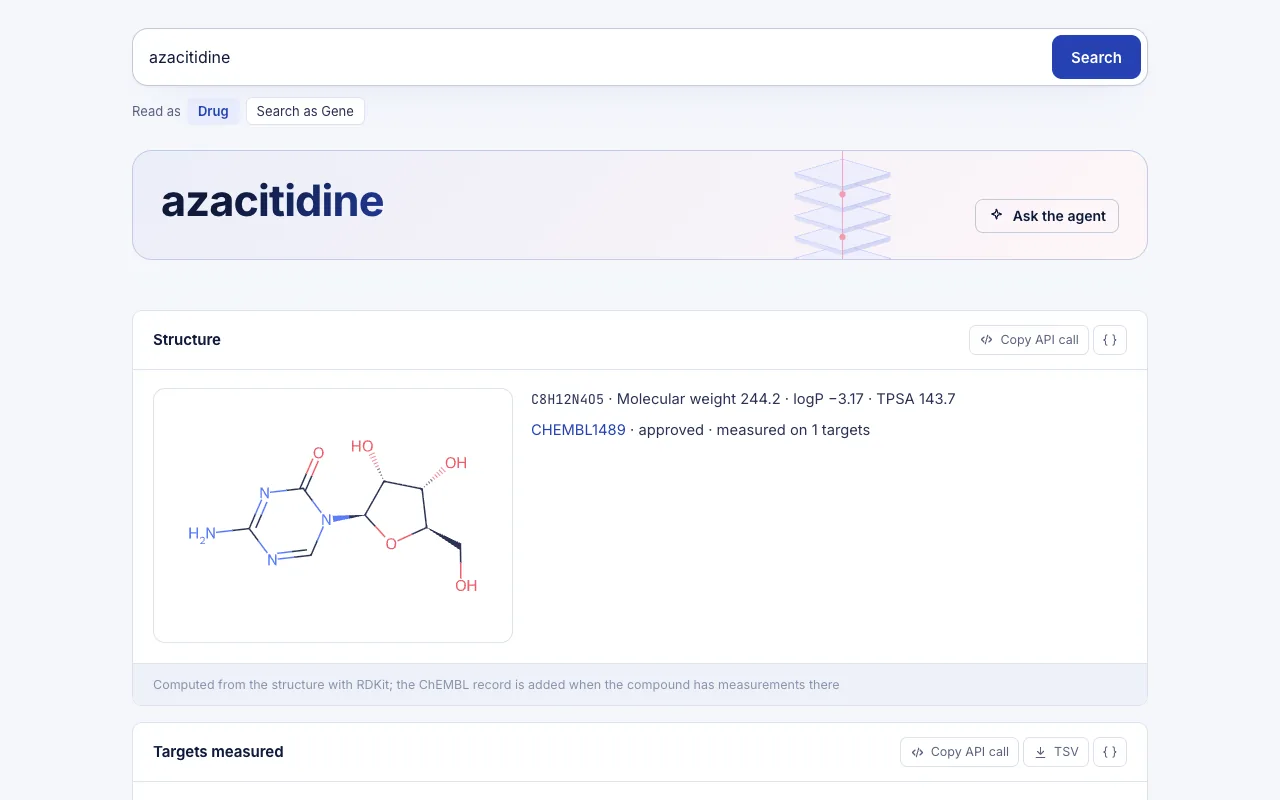
Azacitidine Ropeginterferon trial NCT07646821
Phase 1b/2 trial NCT07646821 adds ropeginterferon alfa-2b to azacitidine in TP53-mutated MDS/AML; ChEMBL, ClinicalTrials.gov and DepMap data as of 2026-11-15.
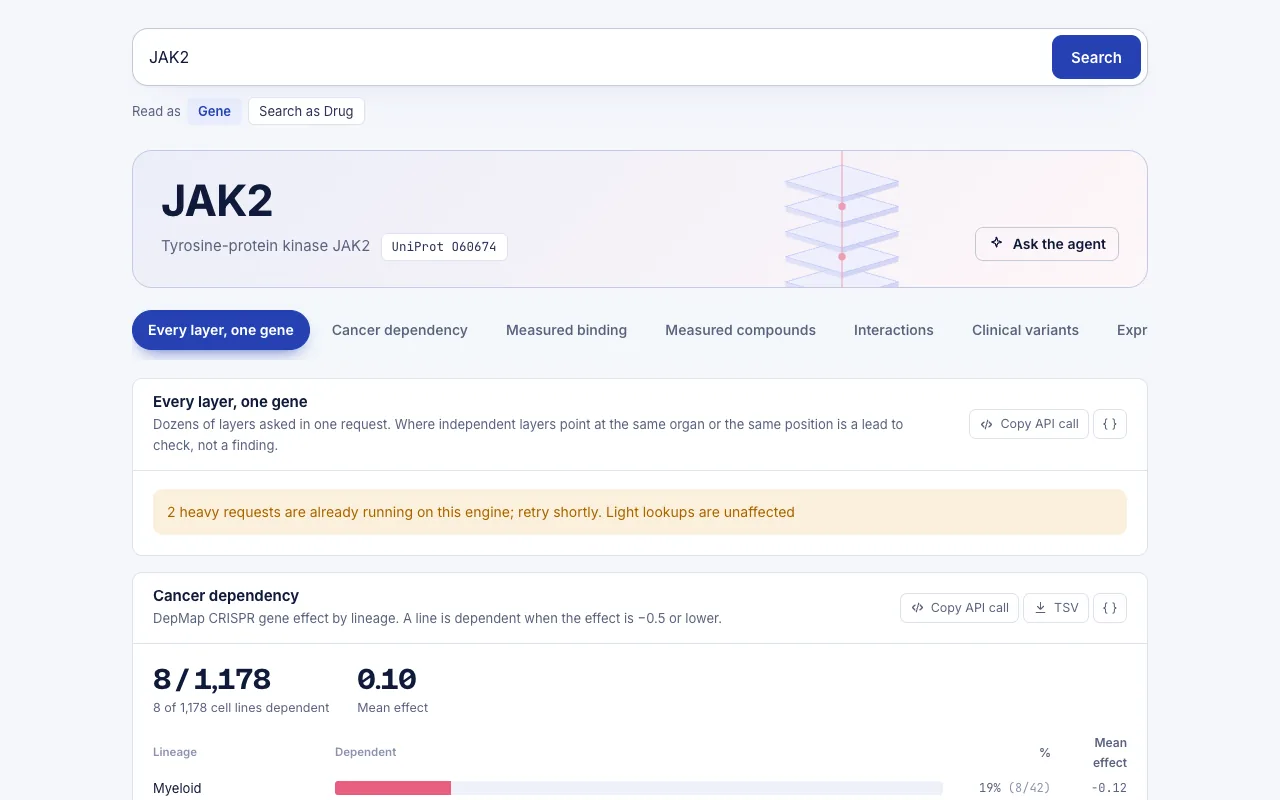
JAK2 vs TYK2: dependency and drugs side by side
JAK2 vs TYK2 in DepMap and drug databases: 8 of 1178 cell lines are dependent on JAK2, 11 on TYK2; 47 drugs are known for JAK2 and 20 for TYK2.