

Cancer lineage dependency of a gene: KRAS in DepMap
How to read the cancer lineage dependency of a gene in one query: KRAS across 1178 DepMap Chronos cell lines, with 91.5% of pancreas lines dependent.
Data as of November 6, 2026 · By the BioQ team
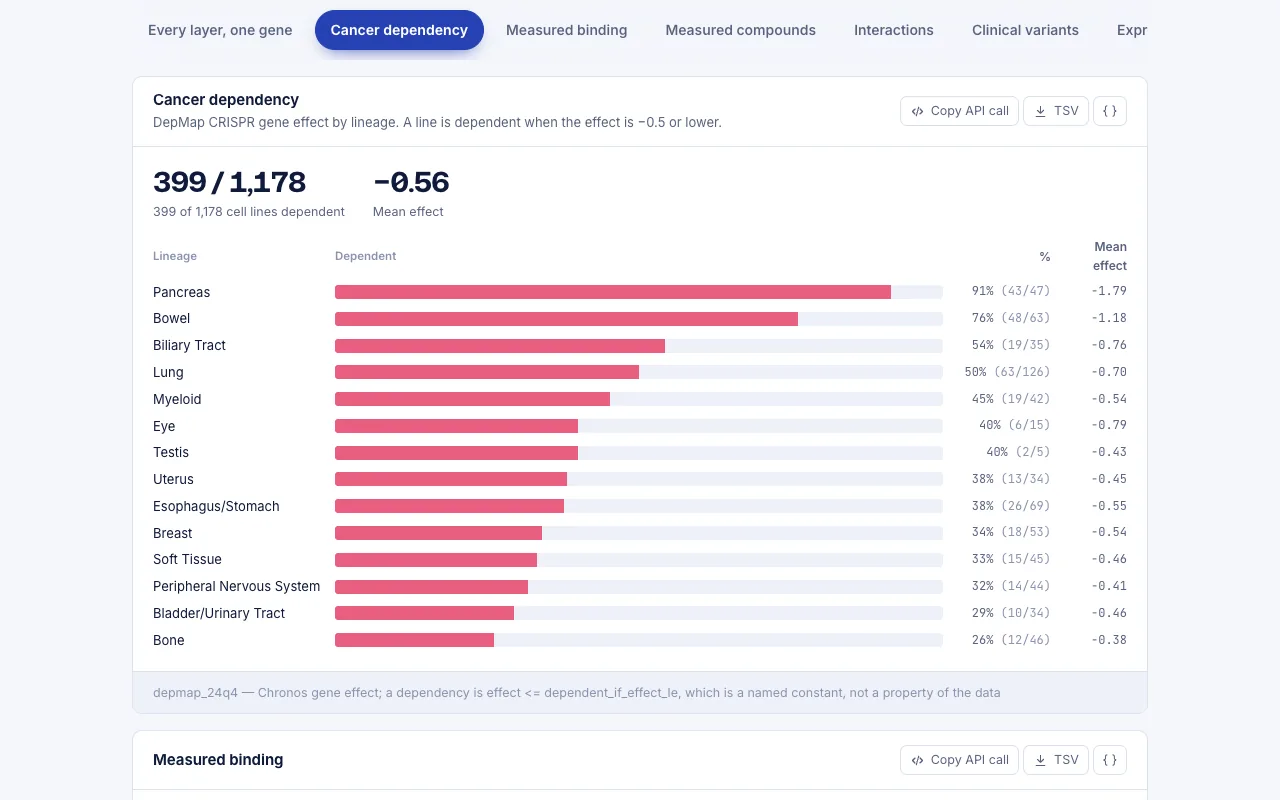
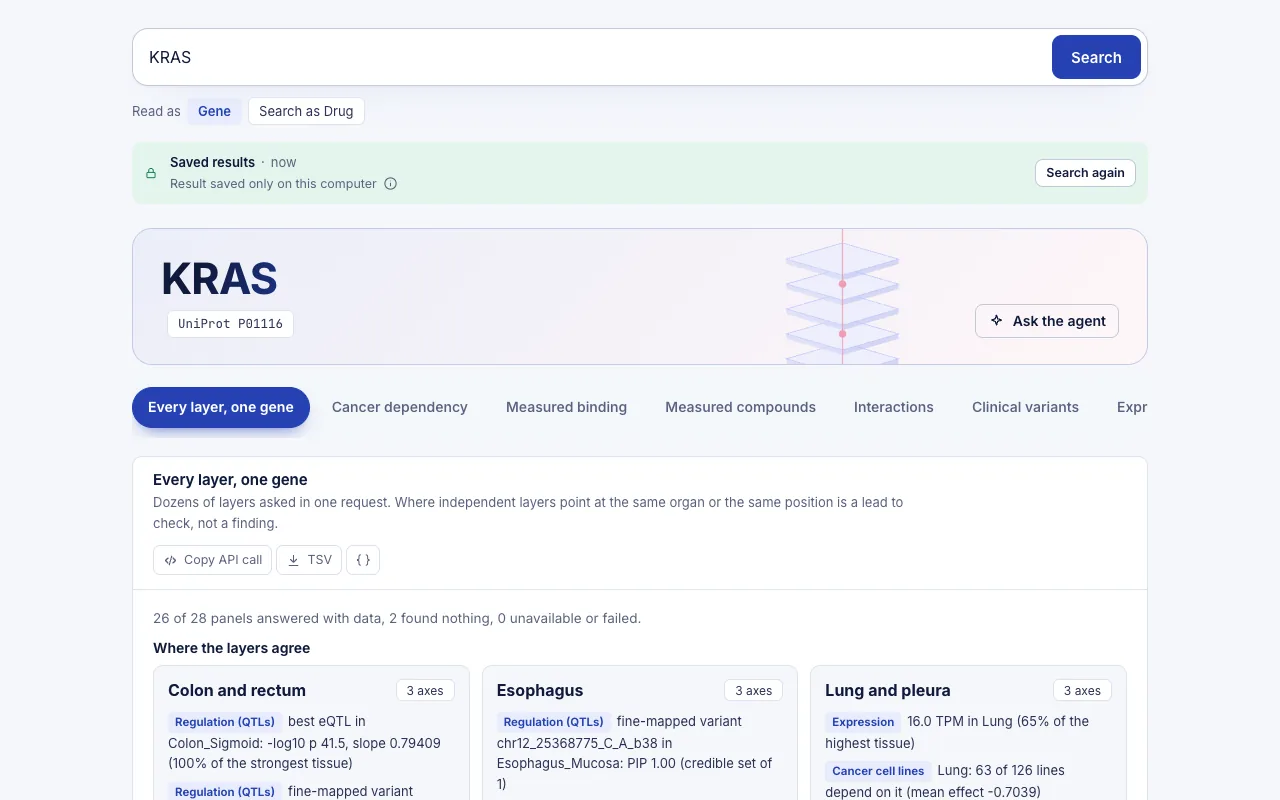
In DepMap (release depmap_24q4), KRAS knockout reduced viability enough to count as a dependency in 399 of 1178 cell lines, or 33.9%. The effect is strongly lineage-specific: 43 of 47 Pancreas lines (91.5%) and 48 of 63 Bowel lines (76.2%) are dependent. One BioQ query returns this cancer lineage dependency of a gene as a ranked table. The data are as of 2026-11-06.
What we asked
The task is common in target work: for one gene, in which cancer lineages does losing it hurt the cells, and is the effect broad or restricted? For KRAS we want to know whether the signal is spread evenly across tumour types or concentrated in a few. We also want to see whether expression in tumour tissue says anything about it.
The manual route has several steps. You open the DepMap portal and download the Chronos gene effect for the gene. You group the cell lines by lineage and apply a dependency threshold. Then you open a second resource, such as TCGA and GTEx, to compare tumour and normal expression. Each step has its own file format and its own lineage naming.
In BioQ the input is the gene symbol alone:
KRAS
What BioQ returned
The query drew on 2 distinct resources, DepMap and TCGA/GTEx (Toil recompute), through 2 engine queries. The measured engine time was 0.18 seconds in total. That figure covers the engine only, not the time you spend reading the output.
The first block is CRISPR knockout viability by lineage from DepMap Chronos. A more negative Chronos gene effect means the knockout reduced viability more. The scalars for KRAS are 1178 cell lines, 399 dependent, a mean gene effect of -0.557, and common essential: false. The table shows the top 8 lineages, ordered by mean gene effect.
| Lineage | Cell lines | Dependent | % dependent | Mean gene effect |
|---|---|---|---|---|
| Pancreas | 47 | 43 | 91.5 | -1.79 |
| Bowel | 63 | 48 | 76.2 | -1.178 |
| Eye | 15 | 6 | 40 | -0.789 |
| Biliary Tract | 35 | 19 | 54.3 | -0.76 |
| Lung | 126 | 63 | 50 | -0.704 |
| Esophagus/Stomach | 69 | 26 | 37.7 | -0.552 |
| Breast | 53 | 18 | 34 | -0.538 |
| Myeloid | 42 | 19 | 45.2 | -0.535 |
The second block compares tumour with normal expression across the 24 cancer types that have both sample groups. It shows the top 6 rows, in log2(norm_count+1) units.
| Cancer type | Tumours | Normals | Mean tumour | Mean normal | log2 fold |
|---|---|---|---|---|---|
| Glioblastoma Multiforme | 153 | 5 | 10.38 | 11.27 | -0.12 |
| Thymoma | 119 | 2 | 10.09 | 10.78 | -0.1 |
| Rectum Adenocarcinoma | 92 | 10 | 11.05 | 11.72 | -0.08 |
| Colon Adenocarcinoma | 288 | 41 | 10.98 | 11.59 | -0.08 |
| Skin Cutaneous Melanoma | 102 | 1 | 9.82 | 10.42 | -0.09 |
| Stomach Adenocarcinoma | 414 | 36 | 11.73 | 11.14 | 0.07 |
What it means and how to read it
Lineage selectivity. Pancreas stands apart, with a mean gene effect of -1.79 and 43 of 47 lines dependent. This is the KRAS pancreas dependency in cell-line form. Bowel follows at -1.178. Lung is a large group of 126 lines with a mean of -0.704, and 63 of them (50.0%) are dependent. That is a split population, not a uniform effect.
Not common essential. The flag is false for KRAS. Across all 1178 lines only 33.9% are dependent, so the gene behaves as a selective dependency, not a pan-cancer requirement. Where it matters is the lineage.
Mean and percent answer different questions. The table is sorted by mean gene effect, so percent dependent is not monotonic down the rows. Biliary Tract has 54.3% dependent lines but ranks below Eye, where 40.0% are dependent. Eye has only 15 lines, and Myeloid has 45.2% dependent but a mean of -0.535. Read both columns, and read the cell-line count before trusting a lineage-level percentage.
Expression is not the same as dependency. In the TCGA/GTEx rows shown, log2 fold changes are small, from -0.12 in Glioblastoma Multiforme to 0.07 in Stomach Adenocarcinoma. The lineages with the strongest KRAS dependency in DepMap, Pancreas and Bowel, are not the ones that stand out here. Colon Adenocarcinoma shows -0.08, with 288 tumours and 41 normals. Tumour versus normal mRNA level is therefore a poor stand-in for functional dependence on the gene. Some rows also rest on very few normal samples: Skin Cutaneous Melanoma has 1 normal and Thymoma has 2.
What to do next. Take the lineages at the top of the table and check the mutation status of the lines behind them. Then compare the same lineages for related genes in the pathway, and look at drug and trial evidence for the lineage you care about. Each of these is a separate query. The table tells you where to look, not what to conclude.
How to reproduce it in BioQ
- Open BioQ and make sure the search covers the DepMap and TCGA layers (the default does).
- Enter the gene symbol exactly as below.
KRAS- In the DepMap block, check the release name and the note on the Chronos sign before reading any value.
- Read the scalars first (cell lines, dependent, common essential), then the lineage rows. Compare the Cell lines column with the % dependent column.
- Open the TCGA/GTEx block only after the dependency pattern is clear, and use it as context for expression, not as evidence of dependency.
- Every row carries its source name, so you can cite the resource and release in your notes.
Limits: what the data do not show
- A dependency here means the Chronos gene effect fell at or below a named threshold. That threshold is a convention of the analysis, not a property of the biology. A different cut-off would change the counts.
- DepMap measures CRISPR knockout viability in cultured cell lines. It does not show how a tumour in a patient or an animal responds, nor how a drug against the target would act.
- Lineage groups differ in size. Small groups such as Eye, with 15 lines, give unstable percentages.
- The table lists only the top 8 lineages by mean gene effect. Lineages below that cut are not shown here.
- The result carries no information on which KRAS mutation each line carries, so it cannot say which genotype drives the dependency.
- TCGA/GTEx compares bulk tissue expression. It says nothing about protein activity, and normal sample counts are low for some cancer types.
- Nothing here is medical or treatment guidance.
Data and method
The numbers on this page were read from the BioQ engine on 2026-11-06 (2 queries, 0.2 s of engine time in total). The tables are generated by code from the engine's answers; the text only restates them.
/depmap, /tcga
Run the same query yourself: KRAS
For research use only. This page summarises public data and is not medical advice.
BioQ is an AI search engine and agent with one goal: making biology research 100X faster. Ask in the web app, over the REST API, or from Claude, ChatGPT or Cursor through MCP.
Queries used
Frequently asked questions
Is KRAS a common essential gene in DepMap?
No. In depmap_24q4 the common essential flag for KRAS is false. Only 399 of 1178 cell lines (33.9%) are dependent, with a mean gene effect of -0.557.
Which cancer lineages depend most on KRAS in DepMap?
Pancreas ranks first by mean gene effect (-1.79), with 43 of 47 lines dependent (91.5%). Bowel follows with a mean of -1.178 and 48 of 63 lines dependent (76.2%).
What does a negative Chronos gene effect mean?
A more negative Chronos gene effect means the CRISPR knockout reduced cell viability more. A line counts as dependent when its effect is at or below a named threshold, which is a convention of the analysis.
Does KRAS expression in tumours predict dependency?
Not in the rows shown. TCGA/GTEx log2 fold changes range from -0.12 to 0.07, while DepMap dependency differs strongly between lineages. Expression and dependency are separate measurements.
How long did the KRAS lineage query take?
The engine used 2 queries across 2 resources and took 0.18 seconds in total. This is engine time only, not reading or follow-up time.
Sources
Results come from public databases as of the date shown and may change. BioQ gives research information, not medical advice.
More from the blog
MDM2 vs MDM4: dependency and drugs side by side
MDM2 vs MDM4 in DepMap 24q4 Chronos data and drug annotations: 384 of 1178 cell lines depend on MDM2, 142 on MDM4; 12 drugs listed for MDM2, 1 for MDM4.
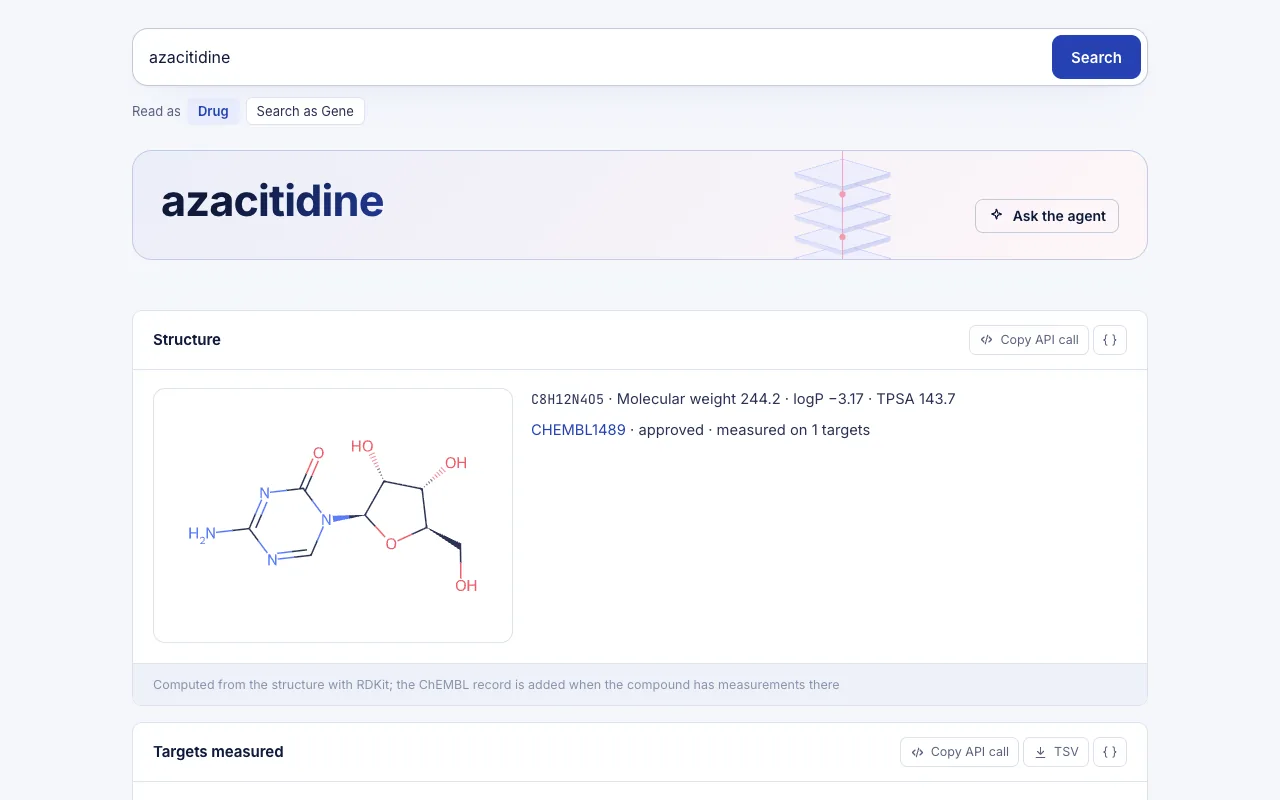
Azacitidine Ropeginterferon trial NCT07646821
Phase 1b/2 trial NCT07646821 adds ropeginterferon alfa-2b to azacitidine in TP53-mutated MDS/AML; ChEMBL, ClinicalTrials.gov and DepMap data as of 2026-11-15.
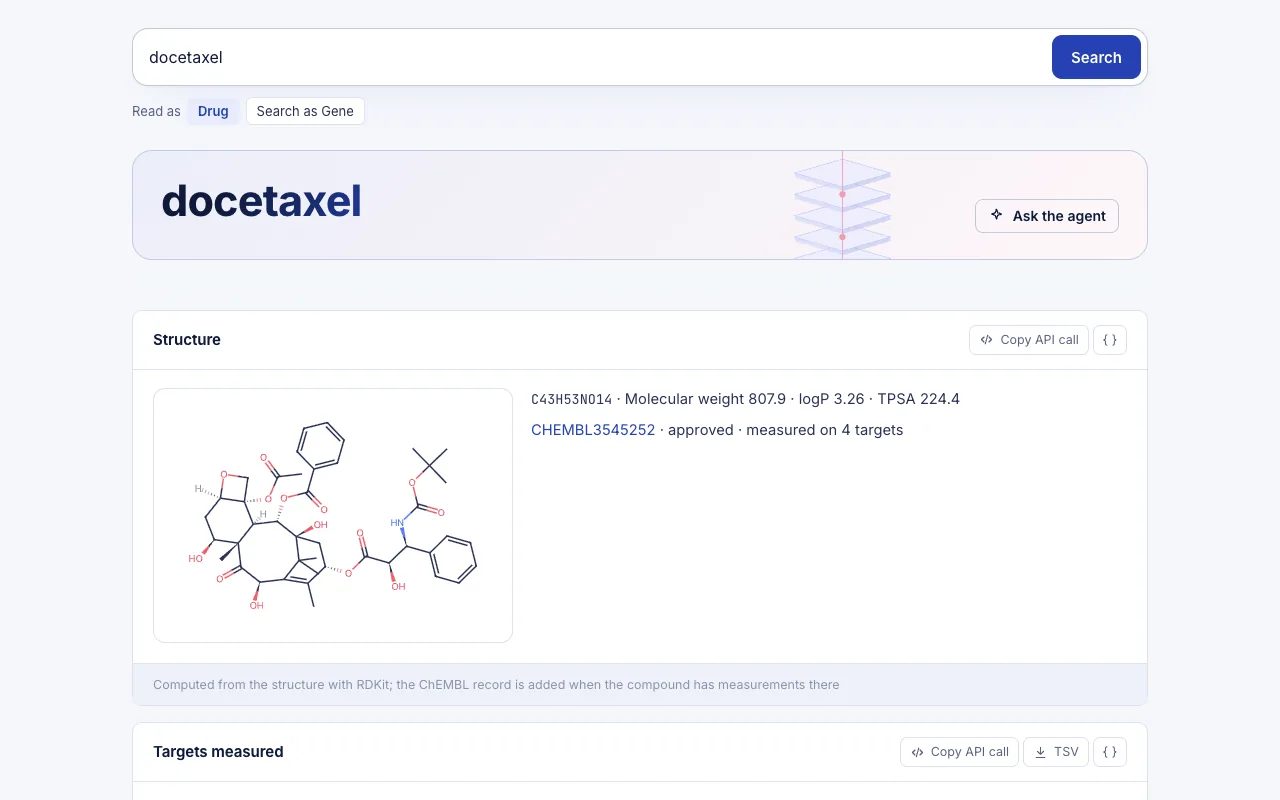
Docetaxel Non-Squamous Non-Small Cell Lung Cancer Trial
NCT07821684 is a phase 3 trial in non-squamous NSCLC; we pair it with docetaxel potency in ChEMBL, 1628 registered trials and EGFR dependency in DepMap.