

EGFR vs ERBB2: dependency and drugs compared
EGFR vs ERBB2 in DepMap Chronos data and drug annotations: 224 of 1178 EGFR-dependent lines versus 177 for ERBB2, and 118 versus 59 known drugs.
Data as of November 6, 2026 · By the BioQ team
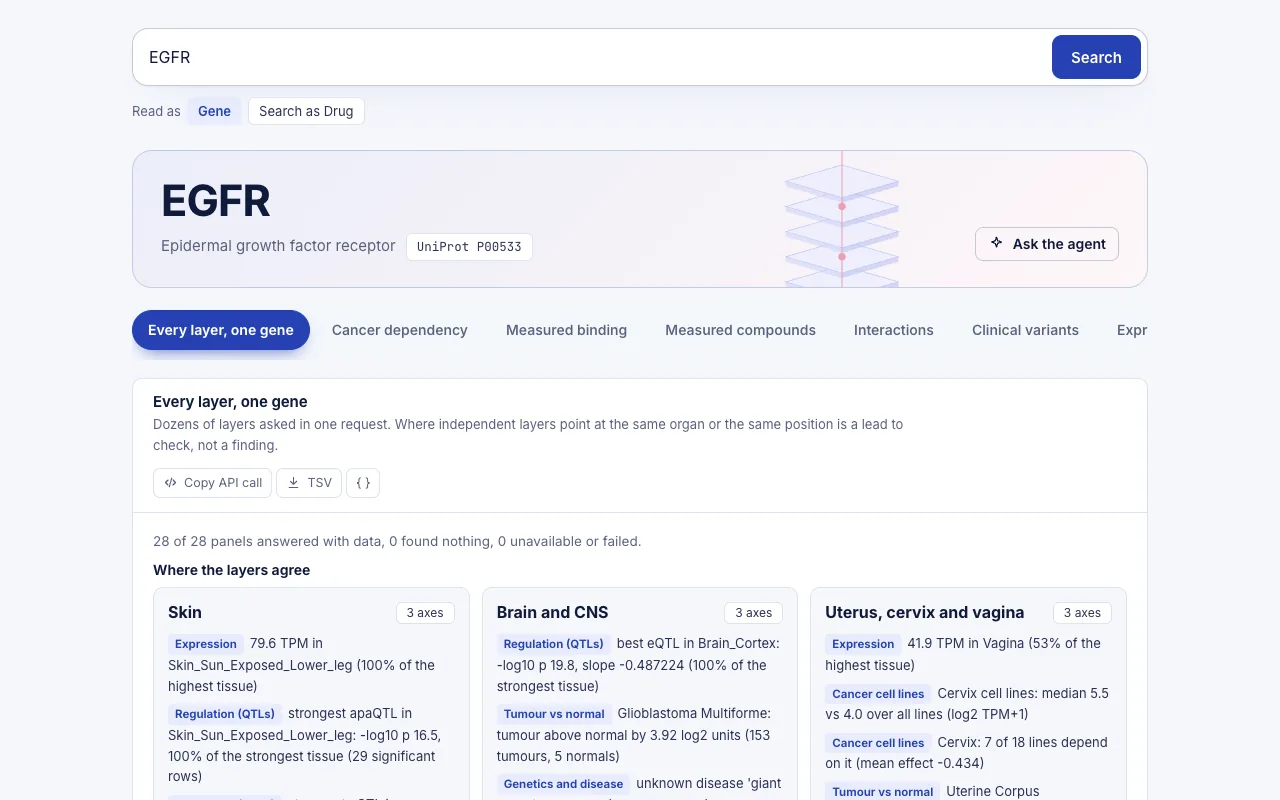
In the DepMap release depmap_24q4, an EGFR knockout reduces viability in 224 of 1178 cell lines (19.0%), against 177 (15.0%) for ERBB2. Neither gene is common essential. EGFR has 118 known drugs and ERBB2 has 59, and Neratinib, Lapatinib and Afatinib appear in both lists. All data are as of 2026-11-06.
What we asked: EGFR vs ERBB2 on dependency and drugs
EGFR and ERBB2 are paralogs in the same receptor tyrosine kinase family, and many kinase inhibitors hit both. We wanted two comparisons, both run with the same blocks for each gene:
- Dependency: how often a CRISPR knockout lowers viability across cancer cell lines, and in which lineages.
- Drugs: which compounds are annotated for each gene, at what clinical stage, and with what exact potency.
The dependency blocks use the Chronos gene effect. A more negative value means the knockout reduced viability more. A line counts as dependent when its effect is at or below a named cut-off. That cut-off is a constant chosen by the analysis, not a property of the data. The drug blocks combine Open Targets, ChEMBL, the Drug Repurposing Hub and ClinicalTrials.gov.
What BioQ returned
Dependency by lineage
Across all 1178 cell lines, EGFR has 224 dependent lines (19.0%) and a mean gene effect of -0.294. ERBB2 has 177 dependent lines (15.0%) and a mean of -0.329. EGFR therefore has more dependent lines, while ERBB2 has the slightly more negative mean. Both are flagged as not common essential.
The five lineages with the most negative mean effect for EGFR:
| Lineage | Cell lines | Dependent | % dependent | Mean gene effect |
|---|---|---|---|---|
| Head and Neck | 77 | 51 | 66.2 | -0.702 |
| Prostate | 10 | 6 | 60 | -0.696 |
| Biliary Tract | 35 | 17 | 48.6 | -0.561 |
| Cervix | 18 | 7 | 38.9 | -0.434 |
| Esophagus/Stomach | 69 | 27 | 39.1 | -0.422 |
The same view for ERBB2:
| Lineage | Cell lines | Dependent | % dependent | Mean gene effect |
|---|---|---|---|---|
| Breast | 53 | 18 | 34 | -0.643 |
| Head and Neck | 77 | 35 | 45.5 | -0.509 |
| Esophagus/Stomach | 69 | 18 | 26.1 | -0.476 |
| Biliary Tract | 35 | 9 | 25.7 | -0.431 |
| Pancreas | 47 | 11 | 23.4 | -0.425 |
Drugs
For EGFR, BioQ lists 118 drugs and shows the top 6 here:
| Drug | Max clinical stage | Mechanism | Best exact pChEMBL | Type | Trials by name |
|---|---|---|---|---|---|
| Osimertinib | APPROVAL | Epidermal growth factor receptor erbB1 inhibitor | 11.7 | IC50 | 188 |
| Afatinib | APPROVAL | Epidermal growth factor receptor erbB1 inhibitor | 11 | IC50 | 112 |
| Mobocertinib | APPROVAL | Epidermal growth factor receptor erbB1 inhibitor | 11 | IC50 | 4 |
| Neratinib | APPROVAL | Epidermal growth factor receptor erbB1 inhibitor | 10.7 | IC50 | 69 |
| Erlotinib | APPROVAL | Epidermal growth factor receptor erbB1 inhibitor | 10.54 | IC50 | 355 |
| Lapatinib | APPROVAL | Epidermal growth factor receptor erbB1 inhibitor | 10.22 | IC50 | 144 |
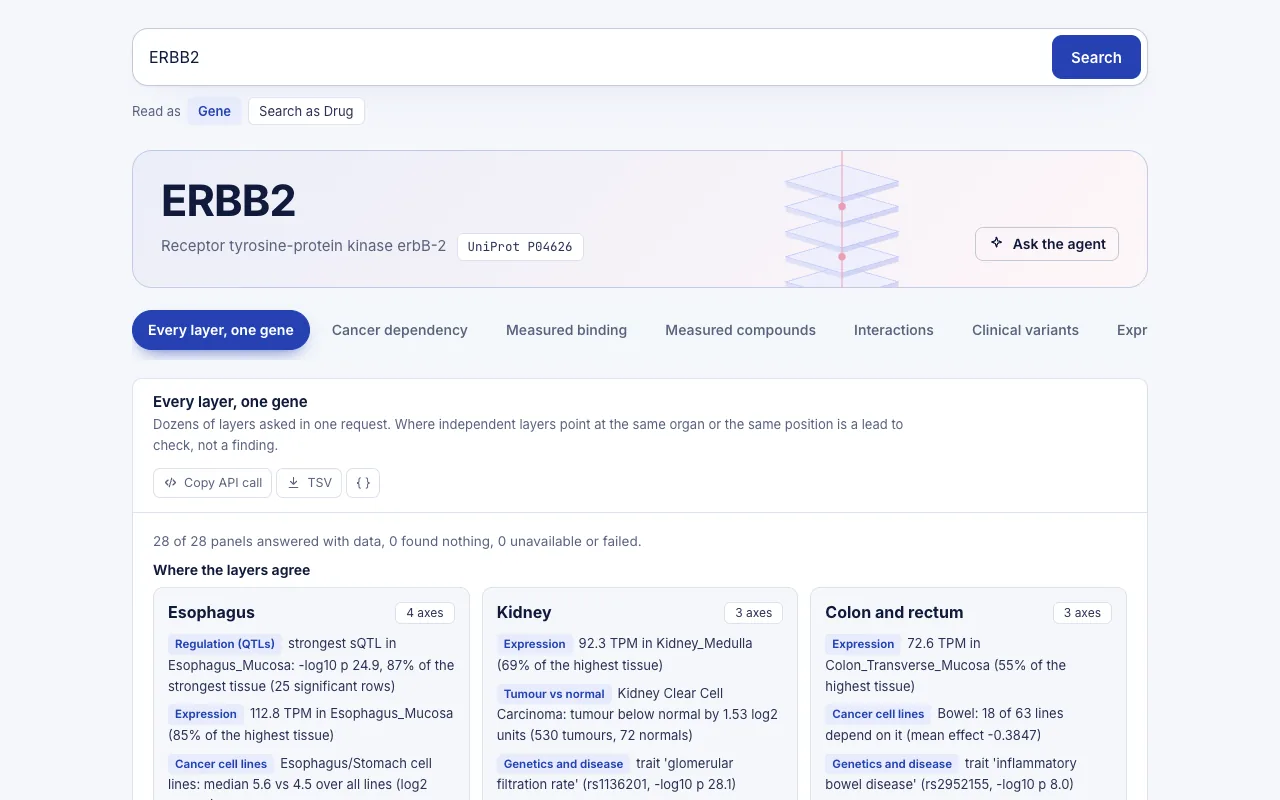
For ERBB2, BioQ lists 59 drugs. The top 6 are Neratinib (exact pChEMBL 9.0, IC50), Lapatinib (8.8, KI), Afatinib (8.7, IC50), Tucatinib (8.7, IC50), Lapatinib Ditosylate (8.52, IC50) and Afatinib Dimaleate (8.3, KD). All six have a maximum clinical stage of APPROVAL.
What it means and how to read it
Where the two genes are alike. Both are non-common-essential, so a knockout hurts only a subset of lines. Head and Neck, Biliary Tract and Esophagus/Stomach appear in the top five for both genes. Head and Neck is the clearest overlap. EGFR has 51 dependent lines of 77 (66.2%), and ERBB2 has 35 of 77 (45.5%).
Where they differ. The strongest EGFR lineages after Head and Neck are Prostate (6 of 10, 60.0%) and Biliary Tract (17 of 35, 48.6%). The ERBB2 list is led by Breast, with 18 of 53 lines dependent (34.0%) and a mean of -0.643. Breast does not appear in the EGFR top five. Prostate and Cervix are absent from the ERBB2 top five, and Pancreas is absent from the EGFR top five. In Esophagus/Stomach, EGFR has 27 of 69 lines dependent (39.1%) and ERBB2 has 18 of 69 (26.1%), yet the ERBB2 mean of -0.476 is more negative than the EGFR mean of -0.422. A lower share of dependent lines does not always mean a weaker average effect.
Drug overlap and selectivity. Neratinib, Lapatinib and Afatinib are annotated for both genes, which fits the shared family. Their listed exact pChEMBL values are higher under EGFR than under ERBB2:
- Neratinib: 10.7 for EGFR, 9.0 for ERBB2.
- Lapatinib: 10.22 for EGFR, 8.8 for ERBB2.
- Afatinib: 11.0 for EGFR, 8.7 for ERBB2.
Treat this as a pointer for EGFR ERBB2 selectivity, not a measured ratio. The values are single highest exact measurements, and the assay type differs in places. Lapatinib is IC50 for EGFR but KI for ERBB2. Tucatinib appears among the top six for ERBB2 with 56 trials by name, but not among the top six for EGFR. That list is truncated, so it does not show whether Tucatinib is absent from the full EGFR set.
The trial counts are matched by drug name, not by gene. Neratinib (69), Lapatinib (144) and Afatinib (112) therefore show identical counts under both genes. They also do not separate trials in EGFR-driven disease from trials in ERBB2-driven disease.
How to reproduce it in BioQ
BioQ drew on 2 distinct resources for this comparison. It ran 4 engine queries in 1.09 engine seconds, and every block names its source and release. Doing the same by hand means matching gene identifiers, lineage definitions and drug names across separate portals.
- Open BioQ and enter the query below.
- Read the dependency block (DepMap, Chronos) and the drug block for EGFR.
- Repeat with ERBB2 in place of EGFR, so both genes use the same blocks and the same parameters.
- Compare lineage rows and shared drug names. Check the assay type next to each pChEMBL value before comparing potencies.
EGFRLimits: what the data do not show
- Cell lines are not tumors. A dependency in a cultured line does not show the same dependency in a patient.
- The cut-off is a convention. The dependent counts and percentages depend on the named threshold. The mean gene effect does not.
- Small lineages are noisy. Prostate has only 10 lines, so its 60.0% rests on very few observations.
- Top-five lists are truncated. A lineage missing from one list may still show a dependency. It just ranks lower by mean effect.
- Potency values are not matched pairs. The pChEMBL figures are single exact measurements from different assays, so they do not give a clean selectivity ratio.
- Annotation is not evidence of benefit. The drug layer shows maximum clinical stage and potency, not outcomes or suitability for any patient. Trial counts by name do not link a trial to a gene.
Data and method
The numbers on this page were read from the BioQ engine on 2026-11-06 (4 queries, 1.1 s of engine time in total). The tables are generated by code from the engine's answers; the text only restates them.
/depmap, /drugs
Run the same query yourself: EGFR
For research use only. This page summarises public data and is not medical advice.
BioQ is an AI search engine and agent with one goal: making biology research 100X faster. Ask in the web app, over the REST API, or from Claude, ChatGPT or Cursor through MCP.
Queries used
Frequently asked questions
How many cell lines depend on EGFR compared with ERBB2 in DepMap?
In depmap_24q4, 224 of 1178 cell lines (19.0%) are dependent on EGFR, and 177 of 1178 (15.0%) are dependent on ERBB2. Neither gene is flagged as common essential.
Which lineages are most dependent on EGFR and on ERBB2?
For EGFR, Head and Neck leads with 51 of 77 lines dependent (66.2%). For ERBB2, Breast leads with 18 of 53 (34.0%). Head and Neck also appears in the ERBB2 top five, at 35 of 77 (45.5%).
How many drugs are known for EGFR versus ERBB2?
BioQ lists 118 drugs for EGFR and 59 for ERBB2. Neratinib, Lapatinib and Afatinib appear in the top six for both genes.
Do the pChEMBL values show EGFR ERBB2 selectivity?
For Neratinib, Lapatinib and Afatinib, the listed exact pChEMBL is higher for EGFR (10.7, 10.22, 11.0) than for ERBB2 (9.0, 8.8, 8.7). These are single measurements, and Lapatinib's ERBB2 value is a KI while its EGFR value is an IC50, so they are not a matched selectivity ratio.
How long does the EGFR vs ERBB2 comparison take in BioQ?
The 4 engine queries took 1.09 engine seconds in total and drew on 2 distinct resources.
Sources
Results come from public databases as of the date shown and may change. BioQ gives research information, not medical advice.
More from the blog
MDM2 vs MDM4: dependency and drugs side by side
MDM2 vs MDM4 in DepMap 24q4 Chronos data and drug annotations: 384 of 1178 cell lines depend on MDM2, 142 on MDM4; 12 drugs listed for MDM2, 1 for MDM4.
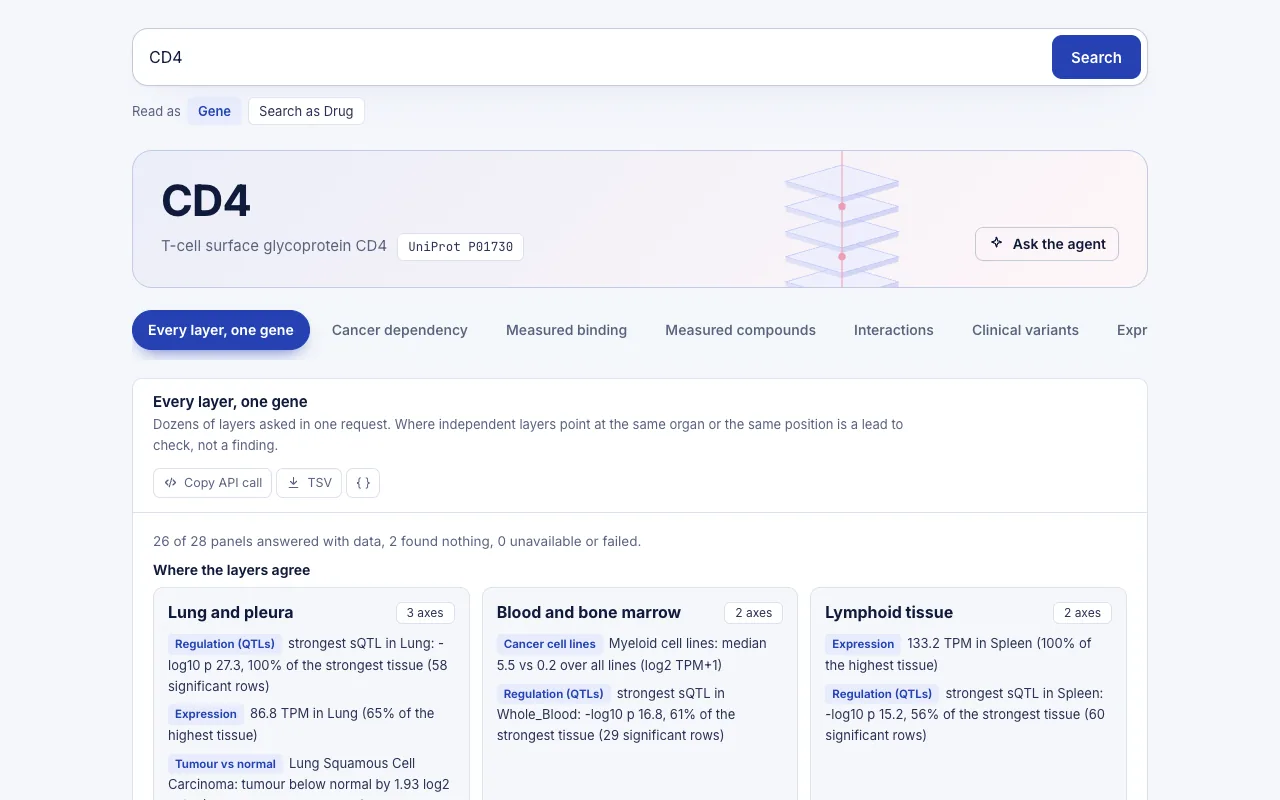
CD4 new study: CAR-NK cells and HIV rebound in context
A CD4-based CAR-NK paper on HIV rebound, placed in context with BioQ data on CD4: DepMap dependency, Open Targets diseases, drugs and Reactome pathways.
GSTM1 new study: cisplatin kidney injury in context
A 2026 paper links GSTM1 loss to worse cisplatin kidney injury; BioQ shows what DepMap, Open Targets, ChEMBL, Reactome and STRING say about GSTM1 today.